How to choose which problem to solve first
If you have more problems than time, the order you tackle them in decides how much actually gets fixed. This guide shows you how to choose which problem to solve first with a five step method you can finish in under an hour: list everything, map what blocks what, score each problem, break ties, then commit to one with a review date. It works for a messy week at home and for a small team with a long backlog.
Why choosing the right first problem matters more than working harder
Most people pick their first problem by feel: the loudest, the newest, or the one someone is asking about. That often means a week spent on a symptom while the cause keeps producing new trouble.
Problems are rarely independent. A late report might come from a slow approval step, which comes from unclear ownership. Fix the report once and it comes back next month. Fix the ownership and three problems shrink at once.
Quality engineers noticed this long ago. The Lean Enterprise Institute describes the Pareto chart as a way of displaying data to prioritize problem solving, and notes that Joseph Juran found 80% of a quality problem is typically caused by 20% of the possible causes. You do not need a chart to use the idea. You need to find the few problems that drive the rest.
Step 1: List every problem without judging it yet
Start with a brain dump: each problem as one short line, with no ranking and no fixes yet. Judging while you list makes you skip the awkward problems, often the important ones.
Good one line problems are specific:
- "Client invoices go out 10 days late"
- "Nobody knows who approves design changes"
- "I sleep 5 hours on weeknights"
Vague lines like "work is chaotic" are hard to act on. If a line feels vague, ask "what would I see if this were fixed?" and rewrite it around that.
In Problem Graph, one line is all you need. You type the problem, put it in a lane (personal, work, expert or scientific) and press Enter. It lands on the graph straight away, so a fast brain dump turns into a map without extra steps. Problems are private by default, so you can be honest about the messy ones.
Step 2: Find the blockers by mapping which problems cause or depend on others
Now look for connections. For each problem, ask two questions:
- Does this problem make another one worse?
- Would this problem get easier if another one were fixed first?
On paper, draw an arrow from the cause to the problem it makes worse. A problem with many arrows pointing out of it is a likely blocker. A problem that only receives arrows is probably a symptom.
This step is where lists fail you. In a list, "invoices go out late" and "nobody owns the billing spreadsheet" sit three lines apart and look unrelated. On a map, the link between them is obvious. Problem Graph lets you link problems that belong together, even across lanes, so a work problem can connect to a personal one like poor sleep. Write which one is the cause in its line, so the direction is never lost. As the home page puts it, patterns show up on the map that never show up in a list.
If you want a more structured way to dig for causes, a fishbone diagram for an everyday problem pairs well with this step.
Step 3: Score each problem on impact, urgency and effort
Give each problem three quick scores from 1 to 5:
- Impact: how much better things get if this is solved. Count the problems it unblocks from Step 2.
- Urgency: how soon it gets worse or costs you something if left alone. A deadline next week scores high. A slow annoyance scores low.
- Effort: how much time and energy a real fix takes. Here, 1 means hard and 5 means easy, so a higher score is always better.
Add the three numbers. The scores are there to force a comparison, not to be precise. Still, ask the question the Lean Enterprise Institute puts at the heart of problem solving: how do you know that? A score built on a fact you checked beats one built on a hunch.
Put the total at the start of each line, for example "13: Nobody owns the billing spreadsheet", and the order shows at a glance. Problem Graph has a List view next to the map for this scan.
Step 4: Apply a tiebreaker such as quick wins, root causes or reversibility
You will usually end up with two or three problems close together at the top. Pick one tiebreaker and use it consistently:
- Root causes first: choose the problem with the most outgoing arrows from Step 2. This is the strongest default.
- Quick wins first: choose the easiest one if you or your team need momentum, or if the problem is blocking someone today.
- Reversibility: choose the problem where a wrong fix is easy to undo. You learn faster when mistakes are cheap.
Pick the tiebreaker before you look at the candidates. Otherwise you will pick the problem you already wanted and invent a reason afterwards.
Step 5: Commit to one problem and set a review date
Choose one problem, not three. Write down the first solution you will try and a date, one or two weeks out, to check how it went. Put that date in your own calendar.
When the review comes, record what happened honestly. In Problem Graph you attach solutions to a problem, mark the one you are trying, and record the outcome as worked, partly or failed. Failed attempts stay on the map. That sounds harsh, but it is useful. The home page says it well: "A solution that failed three times stays on the map as a failed solution, and that is exactly what the next person needs to know." That next person is often you, three months later.
If the first solution worked, move to the next problem on your list. If it partly worked or failed, try another solution or move on. Either way, you now have evidence instead of a feeling.
Worked example: choose which problem to solve first as a team
Here is a made up example of a four person design studio. In a 30 minute meeting, they brain dump these lines into the work lane:
- Client invoices go out about 10 days late
- Nobody owns the billing spreadsheet
- Feedback rounds drag past three revisions
- No written scope in proposals
- New hires take weeks to find files
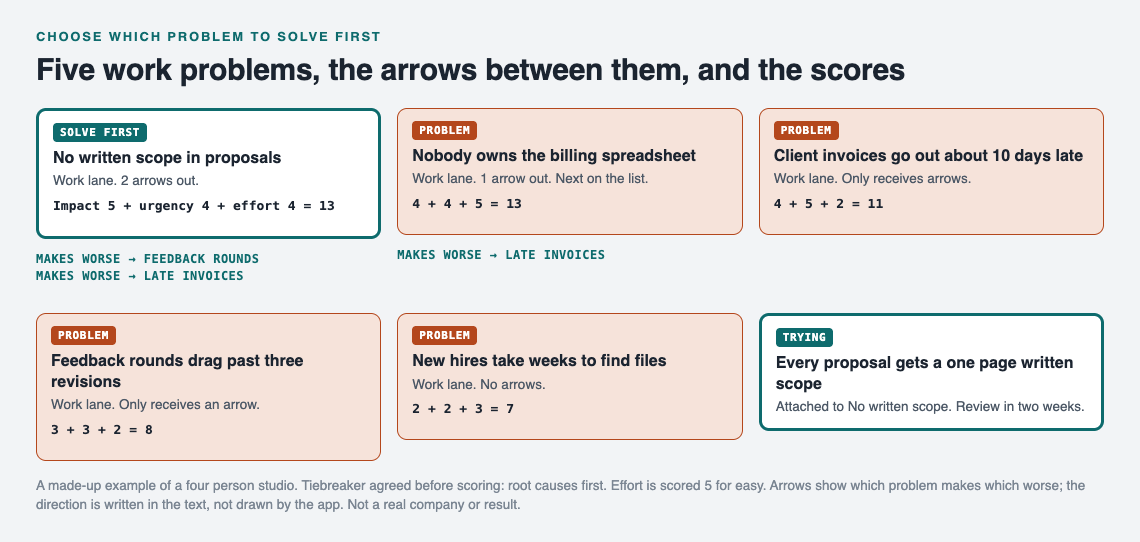
A made-up example: five problems, the arrows between them, and the scores.
Mapping. They link 2 to 1, because without an owner the spreadsheet is always out of date. They link 4 to 3, because without a written scope clients keep asking for more. They link 4 to 1 as well, since unclear scope means arguments over the final bill, which delays invoices. Problem 5 links to nothing.
Scoring.
- Late invoices: impact 4, urgency 5, effort 2. Total 11.
- No billing owner: impact 4, urgency 4, effort 5. Total 13.
- Long feedback rounds: impact 3, urgency 3, effort 2. Total 8.
- No written scope: impact 5, urgency 4, effort 4. Total 13.
- Slow onboarding: impact 2, urgency 2, effort 3. Total 7.
Tiebreaker. "No billing owner" and "No written scope" tie at 13. The team agreed on "root causes first" before scoring. Scope has two outgoing arrows, to feedback rounds and to late invoices. Billing owner has one. So scope goes first, and billing owner is the very next problem.
Commit. The first solution: "Every proposal gets a one page written scope, starting with the next client." Review in two weeks. If the next feedback round stops at three revisions, they mark it worked. If not, they record partly or failed and note why.
The person who keeps the map marks "No written scope" as a main node and shares it into a private network, then gives the other three the invite code. When a main node is shared, its solutions, their outcomes and the requirements they need go with it. Problems that are only linked to it stay private. For more on running a shared record like this, see a small team knowledge base for problems and fixes and how to track work problems without a ticket system.
If the team gets stuck for ideas, Problem Graph can show similar problems other people have shared and which of their solutions worked, and a borrowed solution keeps a link back to where it came from. Its AI suggestions are proposals to test, not answers.
Frequently asked questions
What if every problem feels urgent?
Score urgency by asking what happens if you wait two weeks. Most "urgent" problems do not get much worse in that time, and the few that do will separate from the rest quickly.
Should I solve the easiest problem first or the biggest one?
Default to the problem that causes the most other problems, since fixing it shrinks your list fastest. Pick the easiest one only when you need momentum or when it is blocking someone right now.
How do I know if a problem is a root cause or a symptom?
Map the links. A root cause makes other problems worse, so it has links pointing out of it, while a symptom mostly receives links. If fixing it would not change anything else on your list, it is probably a symptom.
How often should I re-prioritize my problem list?
Re-score at each review date, and whenever a new problem appears that links to several old ones, since it may be the real blocker.
Get started
Open Problem Graph and spend ten minutes on Step 1. On an empty graph, "Load example set" shows how problems and solutions look first. Then link what blocks what, score the top few, and commit to one with a review date.
Try Problem Graph: it is free, and you can look around the public network without an account. Write one problem down in a line and attach the first thing you will try.
Comments
No comments yet.
Sign in or make an account to comment.