How to Study for an Ecology Exam: Cycles, Graphs, Models
If you are working out how to study for an ecology exam, start with how the subject is built. Ecology is a set of connected systems: cycles that move matter, energy that flows one way, populations that grow and crash, and graphs that show all of it. A good plan trains three skills: knowing the terms, reading the data, and applying both to a situation you have never seen. This guide covers each one, with worked examples and a 7-day plan.
What an ecology exam actually tests: concepts, data and application
Most ecology papers mix three kinds of question.
- Concepts. Define a niche. Name the process that turns ammonium into nitrate. State what carrying capacity means.
- Data. Read a predator-prey graph, a survivorship curve or the results of a field experiment, and say what it shows.
- Application. Predict what happens to a lake if a fertilizer runs into it, or to a population if a predator is removed.
Definitions are the easiest to reread, so it is tempting to revise only those. Check how your past papers split their marks and plan your time to match. If you also take immunology or neuroscience, you will notice the same pattern of terms, pathways and data.
Map the levels of ecology: individuals, populations, communities, ecosystems
Before you learn details, draw one page that places every topic on a level.
- Individual: adaptations, tolerance ranges, behaviour.
- Population: one species in one area. Density, birth and death rates, growth models.
- Community: several species interacting. Competition, predation, mutualism, succession.
- Ecosystem: the community plus the nonliving parts. Nutrient cycles, energy flow, productivity.
This map helps in the exam. When a question says "population," you know to reach for growth models. When it says "ecosystem," you think cycles and energy. It also stops you explaining a community change with a single animal's behaviour.
Master the cycles and energy flow: carbon, nitrogen, water and trophic pyramids
Matter cycles. Energy flows through once and leaves as heat. Hold on to that one sentence and half the topic falls into place.
The cycles
For each cycle, learn three things: the reservoirs (where the element sits), the processes that move it, and what humans change.
- Carbon: photosynthesis pulls CO2 in. Respiration, decomposition and combustion put it back. Fossil fuels are a long-term store that burning releases quickly.
- Nitrogen: fixation (N2 to ammonia, by bacteria or lightning), nitrification (ammonium to nitrite to nitrate), assimilation (plants take up nitrate), ammonification (decomposers return ammonium), denitrification (nitrate back to N2 gas).
- Water: evaporation, transpiration, condensation, precipitation, runoff, infiltration.
Draw each cycle from memory on a blank page. Then check it against your textbook. Whatever you left out is what you study next.
Trophic pyramids
Roughly 10% of the energy at one trophic level passes to the next. The rest is lost as heat through respiration, or never eaten. That is why food chains are short. Know the three pyramid types. A pyramid of energy is never inverted. A pyramid of numbers can be, because one tree can feed thousands of insects. A pyramid of biomass can be inverted in water, where fast-reproducing phytoplankton support a larger standing mass of zooplankton.
Practice population models: exponential growth, logistic growth and carrying capacity
You need two equations and the shapes they make.
- Exponential growth:
dN/dt = rN. Growth rate rises as the population rises. The graph is a J-shaped curve. It happens when resources are unlimited, such as a species arriving on an empty island. - Logistic growth:
dN/dt = rN(K - N)/K. HereKis carrying capacity. AsNnearsK, the bracket shrinks toward zero and growth slows. The graph is an S-shaped curve.
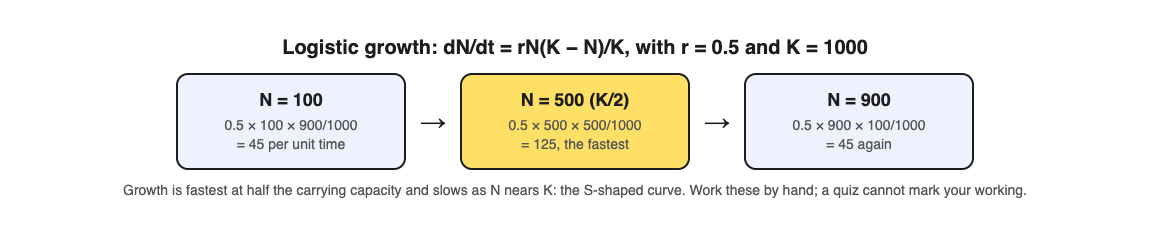
Do a quick worked example. Let r = 0.5 and K = 1000. When N = 100, growth is 0.5 × 100 × 900/1000 = 45 per unit time. When N = 500, it is 0.5 × 500 × 500/1000 = 125. When N = 900, it drops back to 45. Growth is fastest at K/2. That single fact answers a lot of multiple-choice questions. Do these substitutions by hand: a multiple-choice quiz cannot mark your working.
Also learn the factors behind the curves. Density-dependent factors, such as disease, competition and predation, get stronger as the population grows. Density-independent factors, such as floods and frost, hit regardless of size.
Read ecological graphs and data like an examiner: survivorship curves, predator-prey cycles and experiments
A few graph types come up often. Learn to read each one in a fixed order: axes, units, overall trend, then the exception.
- Survivorship curves. The y-axis is usually on a log scale. Type I (humans, large mammals) stays flat, then drops late in life. Type II (many birds) falls at a steady rate. Type III (oysters, many fish, plants) drops steeply early, because most offspring die young.
- Predator-prey cycles. Both populations rise and fall, but the predator peak comes after the prey peak. Explain the lag: predators need prey to breed, so their numbers trail behind.
- Experiments. Look for the independent variable, the dependent variable, the controls, the sample size and whether the result could be chance. "Suggest one improvement" questions usually want more replicates or a controlled variable.
Practise by covering the caption of a textbook figure and writing your own two-sentence description. Then compare it to the real caption.
Turn terms and case studies into active recall flashcards
Rereading feels productive but tests nothing. In a 2006 study by Roediger and Karpicke, students who took recall tests on a passage remembered more of it two days and one week later than students who reread it, even though rereading made them feel more confident.

Study Shot, a web app, is one way to build that practice from the pages you already have. You photograph a page from a textbook, your notes or a whiteboard, and it writes multiple-choice questions about it. Each question has four choices and one right answer, and after you check your answer you see a short explanation. Here is a workflow for the nitrogen cycle.
- Open the site in your phone or computer browser and choose Make a new quiz, then Take photo. Hold the textbook page flat and fill the frame. Diagrams work too.
- Pick 15 questions and leave the level on Tiered. Tiered is a ladder that splits the questions as evenly as it can across Basic, Intermediate and Advanced, in that order. With 15 questions, that is 5 at each level.
- Press Create questions. It can take up to a minute.
- Answer one question at a time. If you need to check a detail, Show page brings back your photo.
The results screen gives you a right/total score for each level. That tells you something specific. If you got 5 of 5 on Basic but 2 of 5 on Advanced, you know the terms but cannot yet apply them, so your next session should be scenario questions, not more definitions. The Look at these again list shows each missed question with your answer and the right answer.
Quizzes are saved in your library with the page photo and your best score, so you can retake them later. You can also share a quiz by link with your study group. Each person needs an account and gets their own copy, without your photo. One honest caution: an AI model writes the questions, and it can make mistakes. Read the explanation against your textbook. If a question looks wrong, use Report a problem with this question under it.
How to study for an ecology exam in 7 days: a plan with past paper practice
- Day 1: Draw your levels map. List every topic on the syllabus and mark each one red, amber or green.
- Day 2: Cycles. Draw carbon, nitrogen and water from memory. Make a practice quiz from your cycle notes.
- Day 3: Energy flow and pyramids. Work three 10% rule calculations.
- Day 4: Population models. Solve five logistic growth substitutions by hand. Sketch J and S curves with labels.
- Day 5: Graphs. Describe ten figures without reading their captions. Do the data questions from one past paper.
- Day 6: A full past paper under timed conditions. Mark it with the mark scheme and note the exact words it rewards.
- Day 7: Retake your weakest saved quizzes, reread your missed-question lists and redo any past paper question you lost marks on.
Spread the work out: a 2006 review of 317 experiments by Cepeda and colleagues found that spacing study sessions apart helps retention. The same spaced approach works in other applied sciences; see how to study for a sports science exam for a similar plan.
Frequently asked questions
How long should I study for an ecology exam?
For a unit test, a focused week of one to two hours a day is usually enough. For a final exam, start two to three weeks out so you have time for at least two timed past papers.
What is the hardest part of ecology to learn?
Often it is applying ideas to new data, such as explaining an unfamiliar graph or predicting the effect of a change in an ecosystem. Practise with past paper data questions and advanced-level quiz questions rather than more definitions.
How do I memorize the nitrogen cycle?
Learn the five processes in order (fixation, nitrification, assimilation, ammonification, denitrification) and attach the form of nitrogen each one produces. Then draw the cycle from a blank page until you can do it without gaps.
Get started: build your ecology practice quizzes with Study Shot
Pick the page you find hardest, maybe the nitrogen cycle diagram or the logistic growth section, and turn it into questions you have to answer. Study Shot runs in the browser on your phone or computer and can write quizzes in 50 languages.
Try Study Shot: it is free to start. Photograph the page you are studying tonight and get 10 practice questions on it, from basic to advanced.
Comments
No comments yet.
Sign in or make an account to comment.