Pareto principle for everyday problems: fix the few
The Pareto principle applied to everyday problems says: fix the few that cause most of the trouble, and stop spreading your effort across everything at once. At home, at work and in a budget, a small number of recurring problems can eat most of your time, money and calm. This post shows you how to find those few, trace them to their causes, and fix them first, with a simple four step method you can start tonight.
What the Pareto principle says
The Pareto principle is often stated as 80/20. The Lean Enterprise Institute's entry on the Pareto chart says the term comes from Vilfredo Pareto, who coined the 80/20 rule, and that Joseph Juran later, in 1941, extended it to quality problems, finding that 80 percent of a problem is typically caused by 20 percent of the possible causes. The same page describes a Pareto chart as a bar chart of how often each cause occurs, with a line for the running total. Treat 80/20 as a rule of thumb, not an exact split.
For everyday life, it means this. If you list every annoyance that keeps coming back, a handful of them will account for most of the cost. The rest are real, but small. The work is to tell the two groups apart and spend your energy on the first one.
Why fixing everything at once keeps you stuck
When you try to fix every problem at the same time, three things can happen.
- You spread thin. Effort split ten ways leaves each problem with a little.
- You may pick the easy ones. Small problems are quick to cross off, so they can take attention while the costly ones wait.
- You forget what you tried. Without a record, you repeat a fix that already failed, or drop one that was partly working.
The fix is not more willpower. It is a list, a count and a ranking.
Step 1: List every recurring problem in one place
Write down every problem that has happened more than once in the last month. One line each. Do not solve anything yet. Do not judge size yet.
Keep it concrete. "Mornings are chaotic" is vague. "Can't find keys before leaving" is a problem you can count. A good list might look like this:
- Can't find keys before leaving
- Late fee on the electricity bill
- Laptop battery dies in meetings
- Dishes pile up in the shared kitchen
- Re-explaining the same task to a new coworker
- Subscription renewed that I don't use
- Run out of coffee on Mondays
One place matters. Problems split across notes apps, sticky notes and your head never get compared.
Step 2: Count how often each problem costs you time, money, or calm
Now attach a cost to each line. Use whatever unit fits.
- Time: minutes lost each time, times how often it happens.
- Money: fees, waste, replacements.
- Calm: a simple 1 to 5 score for how much it rattles you.
Do a rough count over two weeks. Make a tally mark each time a problem shows up. Rough is fine. You are looking for big gaps, not precise numbers.
A worked example. Over two weeks:
- Keys: 8 times, about 5 minutes each, calm score 4. That is 40 minutes and a lot of stress.
- Late fee: once, but it cost money and a calm score of 3.
- Laptop battery: 4 times, each one derailed a meeting. Calm score 5.
- Coffee on Mondays: twice, 10 minutes, calm score 1.
Already you can see that keys and the laptop battery cost far more than coffee. The ranking starts to draw itself.
Step 3: Find the vital few and the root causes behind them
Sort your list by total cost. The top two or three lines are your vital few. Everything below is the trivial many, for now.
Then ask why each of the top problems happens. Sometimes two "different" problems share one cause. The lost keys and the dying laptop battery might both come from having no evening routine by the door, where the keys go down and the laptop goes on charge. The late fee and the unused subscription might both come from never looking at your bank statement.
This is where a map helps more than a list. In Problem Graph, you write a problem in one line and it lands on the graph when you press Enter. You put it in a lane: personal, work, expert or scientific. Then you link problems that belong together, even across lanes. The laptop battery is a work problem and the keys are personal, but if both trace to "no evening routine by the door," linking them shows it. As the site puts it, patterns show up on the map that never show up in a list.
When two of your vital few link to the same cause, that cause is the real target. One fix, two problems gone.
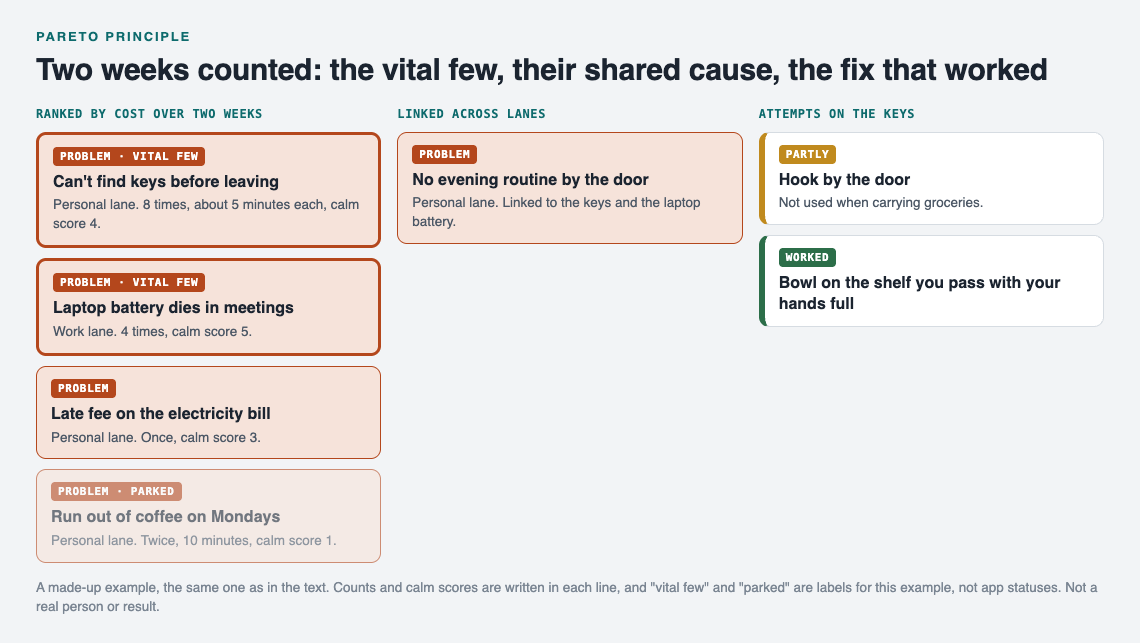
The made-up two-week count from this post, ranked and linked.
Step 4: Fix the few, then park the trivial many
Pick one vital problem. Write down two or three ideas you could try. Try one. Record what happened.
Problem Graph is built for this loop. You attach solutions to a problem as ideas, mark the one you are trying, and record the outcome as worked, partly or failed. A failed attempt stays on the map. That is useful: next time you look at the problem, you see "hook by the door: partly, not used when carrying groceries" and you know why it fell short.
A worked example for the keys:
- Problem: "Can't find keys before leaving." Lane: personal.
- Idea 1: hook by the door. Tried for a week. Outcome: partly. Used it when coming home with free hands, not when carrying groceries.
- Idea 2: bowl on the shelf you pass with your hands full. Tried for a week. Outcome: worked.
Now park the rest. Parking does not mean deleting. The coffee problem stays on your list. You just do not spend effort on it until the vital few are handled. When you finish one, re-rank and pick the next.
If you want ideas for a stuck problem, Problem Graph can show similar problems other people have shared and which of their solutions worked, and you can borrow one into your own graph with one tap. It keeps a link back to where it came from. There is also an AI that proposes new solutions grounded in what worked for others on similar problems. Treat those as proposals to test, then record the outcome like any other attempt.
Real examples: home, work, money, and shared spaces
Home
Possible vital few: losing things, meal decisions at 6 pm, laundry backlog. One routine, like a ten minute evening reset, might fix several at once. Link them on the map before you choose a fix.
Work
Recurring meetings without decisions, the same question from new colleagues, tools that break at bad moments. If you keep re-explaining a task, the fix is often a written note. Our guide on handover notes covers how to pass on open problems and what was tried.
Money
Late fees, forgotten subscriptions and impulse buys can share one cause: not looking. A short weekly review of your statement might help with all three. Count the fees from the last three months to see which problem leads.
Shared spaces
In a shared flat or a volunteer group, the vital few may be the ones everyone complains about but nobody owns. Problem Graph lets you mark one problem as a main node and share it into a private network. You create the network and give a few people the invite code. Members see it and nobody else does. Only the main node and its solutions, outcomes and requirements go along. Problems you only linked to it stay home. For more on this, see solving roommate problems with a shared list and keeping one shared list for a volunteer group.
Frequently asked questions
Is the 80/20 split exact?
No. It is a rough pattern, and your split might be 70/30 or 90/10. What matters is that a few problems cost much more than the rest, so you should find and fix those first.
How do I measure problems that are hard to count?
Use a simple 1 to 5 score for how much each one bothers you, and note each time it comes up. Over two weeks, frequency times score gives you a usable ranking even without minutes or money.
What if the vital few are too big to fix quickly?
Break the big problem into smaller ones and link them together, then fix the piece that costs the most. Record each attempt and its outcome so partial progress is not lost.
How often should I re-rank my problem list?
Re-rank whenever you solve one of the vital few, or once a month if nothing changes. New problems appear and old ones shrink, so the top of the list moves.
Get started
Open the app in your browser. It works on your phone too. Write your top three recurring problems, one line each, and put each in a lane. Link the ones that share a cause. Use the List view beside the map if you want to scan them in order, and filter by lane to focus on home or work. Problems are private by default: they are saved to your account and nobody else sees them.
Try Problem Graph: it is free, and you can look around the public network without an account. Write one problem down in a line and attach the first thing you will try.
Comments
No comments yet.
Sign in or make an account to comment.