What is a breakpoint in debugging?
Your program gives the wrong answer and you have no idea why. You could read the code again, line by line, and guess. Or you could stop the program in the middle of running and look. That is what a breakpoint is for. So what is a breakpoint, exactly? It is a mark you put on one line of code that tells the debugger to pause the program just before that line runs, so you can see every value at that moment.
This guide explains breakpoints in plain words, using Wikipedia and Microsoft's own debugging guides. It walks through a real bug you can find in your browser in about ten minutes, and ends with the free browser game Tank City Reboot, where a Breakpoint is a power-up that freezes the enemy.
What is a breakpoint? The plain definition
Wikipedia's entry on the breakpoint calls it an intentional stopping or pausing place in a program, put there for debugging. Some people simply call it a pause.
The most common kind stops the program immediately before a line or instruction you chose. While the program waits, you look around: which values the variables hold, and which chain of function calls led to this line. Wikipedia puts the bigger idea well: a breakpoint is a way to learn about a program while it runs.
A debugger is the tool that does the pausing. Code editors such as Visual Studio include one, and so does Microsoft Edge, inside its developer tools. If you have Edge, you can try one without installing anything.
Why pause a program at all?
Many beginners debug by adding print lines. In JavaScript that is console.log(): print each value, run the program, read the output, add more prints, run again.
Microsoft's tutorial for debugging JavaScript in Edge DevTools is blunt about it: console.log() might get the job done, but breakpoints get it done faster. A breakpoint pauses your code in the middle of running and lets you examine all the values at that moment, including ones you did not think to print.
There is a second gain. Once paused, you can move forward one line at a time and watch each value change. You see the exact line where the program does something you did not expect, instead of guessing from the output.
The main kinds of breakpoint
Microsoft's guide to breakpoints in the Visual Studio debugger lists several kinds. These are the main ones:
- Line breakpoint. Pause before one chosen line runs. Edge's tutorial calls this the most common type.
- Conditional breakpoint. Pause only when a condition is true, such as a variable having a certain value. Useful inside a loop that runs a thousand times when only one pass is wrong.
- Temporary breakpoint. Pause once, then switch itself off.
- Data breakpoint. Pause when a value changes. In Visual Studio this works for an object's property in .NET Core 3.x or .NET 5 and later projects.
- Tracepoint or logpoint. Print a message instead of pausing. Visual Studio calls it a tracepoint; Wikipedia calls it a logpoint. It gives you a print line without editing the code.
Start with line breakpoints. Reach for the others when a plain pause stops too often or not at the right moment.
A worked example: find the 5 + 1 = 51 bug
Microsoft's Edge tutorial comes with a small demo page that adds two numbers, and it has a bug. Open the tutorial in Edge, open its demo page, and follow along.
- See the bug. Type 5 in the first box, 1 in the second, and click the button. The page says 5 + 1 = 51, not 6.
- Open the debugger. Right-click the page and select Inspect, or press Ctrl+Shift+I on Windows and Linux, Command+Option+I on a Mac. Select the Sources tool, then the page's JavaScript file.
- Set a line breakpoint. Find the line near the end of the function that writes the answer on the page. Click its line number. A red circle appears: the breakpoint is set, and the browser will pause just before that line runs.
- Trigger it. Click the button on the page again. The program stops and the line is highlighted.
- Look inside. The Scope pane lists every variable and its value right now. Add a watch expression,
typeof sum. It shows "string". That is the bug: the two inputs are text, so the plus sign joins them instead of adding them. - Fix it and check. Resume the script, then change the line that computes the sum to
var sum = parseInt(addend1) + parseInt(addend2), which turns both inputs into numbers first. Save, switch the breakpoints off with Deactivate breakpoints, and try again. Now 5 + 1 = 6.
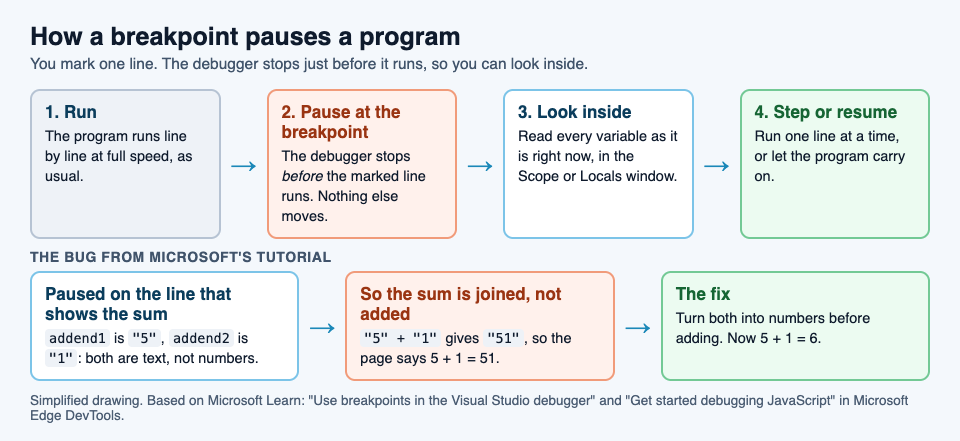
Notice what you did not do. You did not add a single print line, and you did not guess. One pause showed you the wrong type, and the fix followed from it.
Stepping, resuming and switching breakpoints off
Once a program is paused, the debugger gives you a few buttons. These are the ones you will use most:
- Resume. Let the program carry on at full speed until it reaches the next breakpoint, if there is one.
- Step over. Run the next line, including any function it calls, then pause again.
- Step into. Go inside the function on this line and pause on its first line.
- Deactivate. Keep your breakpoints but stop them from pausing, so you can test a fix without deleting them. Edge greys out the icon when they are off.
A good habit: set one breakpoint near where the wrong value appears, read the values, then step backwards in your mind to where the value first went wrong. Put the next breakpoint there.
Learn the idea by playing: the Breakpoint power-up
Tank City Reboot is a tank game set inside a computer. Your antivirus tank guards the CPU core, twenty malware tanks come at it each stage, four at a time, and every enemy, power-up and wall is named for a real computing or security idea.
Breakpoint is one of the power-ups. Pick it up and every enemy on the field freezes for eight seconds: they stop moving and stop firing, just as a debugger stops a program in place. Its card on the page gives the real idea: "A breakpoint makes a debugger pause a running program at a chosen line."
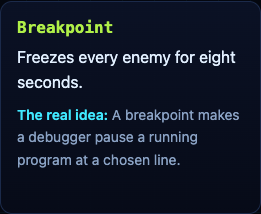
Eight seconds is the time to line up shots on enemies that cannot shoot back. It pairs well with the other power-up named for a programming idea, Garbage collection, which wipes out every enemy on the field; our guide to garbage collection in programming explains that one. For how the game plays overall, see our guide to the retro tank game in your browser. The game teaches the word and one idea; it is not a programming course.
Frequently asked questions
What is a breakpoint in simple words?
A mark on a line of code that makes the debugger pause the program just before that line runs, so you can look at every value at that moment.
Does a breakpoint change my code?
No. You set it in the debugger, for example by clicking a line number in Edge, not by typing anything into the code, and you can switch it off with Deactivate breakpoints.
What is the difference between a breakpoint and a print statement?
A print line shows only the values you chose to print, and you edit the code to add it. A breakpoint pauses the program and lets you inspect every value without changing the code.
What is a conditional breakpoint?
A breakpoint that pauses only when a condition you set is true, such as a counter reaching 500, so you skip the passes that work.
Get started
Play Tank City Reboot: it is free, plays in your browser on a computer or a phone, and needs no account. When a Breakpoint drops, grab it and use the eight frozen seconds to clear the field.
Comments
No comments yet.
Sign in or make an account to comment.