What Is Product-Market Fit and How Do You Measure It?
What is product-market fit and how do you measure it? Product-market fit means a real market wants what you built, enough that people use it, keep using it and tell others. You can feel it, but you should also measure it. This post covers the signs, the main tests and a simple survey you can run this week.
What is product-market fit and how do you measure it?
The phrase comes from the investor and founder Marc Andreessen, who wrote in an essay on startups that product/market fit means being in a good market with a product that can satisfy that market. He also wrote that you can feel when it is not happening: word of mouth does not spread and usage does not grow fast. The idea is simple. You have a group of people with a real problem. Your product solves it well enough that they choose it over their other options.
Two parts matter here. The first is the market: enough people who have the problem and will pay or spend time to fix it. The second is the product: it must do the job better than what they use now, including a spreadsheet or doing nothing.
Product-market fit is not a launch date or a funding round. It is a state your business is in, and it can fade if the market shifts. For AI products this matters more, because a new model release can change what customers expect overnight. If you want the background on why those shifts happen, the lesson Why AI Is a Platform Shift in Age of AI Entrepreneur covers it.
Signs you have it (and signs you don't)
Signs you are close:
- Users come back without a reminder from you.
- People describe your product to others in their own words.
- Customers get upset when something breaks, because they rely on it.
- Sales conversations are short. Buyers already know the problem.
- Growth continues even in weeks when you do no outreach.
Signs you are not there yet:
- People sign up, try it once and vanish.
- Feedback is polite but nobody would be disappointed if you stopped.
- Every sale needs heavy persuasion or a custom favor.
- You keep changing who the product is for.
- Growth only happens when you push hard, and stops when you rest.
These signs are hints, not proof. Your own mood is a weak instrument. Early users are often friends, and friends are kind. That is why you need numbers.
The Sean Ellis 40% survey test
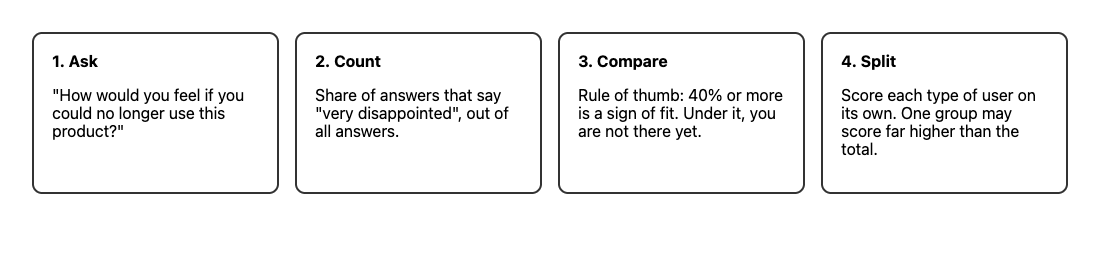
The survey in four steps.
The startup growth advisor Sean Ellis proposed a single-question survey. You ask your users:
How would you feel if you could no longer use this product?
The answers are: very disappointed, somewhat disappointed, not disappointed, or I no longer use it. As First Round Review reports, Ellis found that companies that struggled to find growth almost always had fewer than 40 percent of users answer "very disappointed", while companies with strong traction almost always passed it. Treat 40 percent as a rule of thumb from his experience, not a law of nature.
Some rules make the result honest:
- Survey people who have actually used the product, not everyone who signed up.
- Get enough answers. Thirty is a rough floor, and more is better.
- Do not lead people. Do not say what you hope they will answer.
- Add one follow-up: "What is the main benefit you get from it?" The answers tell you what to build more of.
Because the sample is small, a result of 38 or 42 percent says little. A result of 15 or 60 percent says a lot.
Retention and cohort analysis
Surveys tell you what people say. Retention tells you what they do. Retention is the share of users who are still active after a set time, such as one week or one month.
Cohort analysis groups users by when they joined. You then compare the groups. For example, put everyone who signed up in the first week of March in one cohort and track how many are active in each week after.
Look at the shape of the curve:
- Falls to zero: nobody stays. You have no fit yet.
- Falls, then flattens: a core group stays. That flat line is the clearest sign of fit.
- Newer cohorts flatten higher than older ones: your changes are working.
Pick an activity that counts as real use. For an AI writing tool, logging in is weak. Finishing a document is strong. Define "active" as the action that delivers the value.
Other metrics: NPS, churn, growth and revenue
Net Promoter Score (NPS). You ask, "How likely are you to recommend this to a friend or colleague?" on a scale of 0 to 10. Scores of 9 and 10 are promoters, 0 to 6 are detractors. NPS is promoters minus detractors, as percentages. It is a useful trend line, but it measures goodwill more than need, so use it beside the Ellis question, not instead of it.
Churn. Churn is the share of customers who leave in a period. High churn with steady sign-ups means you are filling a leaky bucket. Falling churn over several months is a strong signal.
Growth rate. A steady weekly growth rate that comes from word of mouth and repeat use points to fit. The Age of AI Entrepreneur blog has a longer read on weekly growth rate.
Revenue and unit economics. If customers pay, check whether each one earns more than it costs to serve and win them. With AI products, model usage costs can eat the margin. The lesson Revenue, Costs and Unit Economics in the course Business Basics for Builders walks through that math.
How to run a simple PMF survey step by step
- Pick your audience. Choose users who have done the core action at least twice, or used the product in the last few weeks.
- Write four questions. Use the Ellis question, then: "What is the main benefit you get?", "What type of person do you think would benefit most?" and "How can we improve it for you?"
- Send it by email or in the product. Keep it under two minutes. A short personal note from you gets more replies than a form blast.
- Collect at least 30 answers. If you do not get that many, widen the group or give it more time.
- Count the "very disappointed" share. Divide those answers by all answers, including "not disappointed."
- Segment the results. Split by user type. Often one segment scores far above the total. Narrowing to the people who love the product is the way First Round's write-up of Superhuman's survey raised its score. That segment is where your fit starts.
- Read the open answers. Group the main benefits by theme. Repeat the survey every few months.
A worked example: you built an AI tool that drafts replies to customer support emails. You survey 50 active users. Nineteen say very disappointed, 20 somewhat, 11 not disappointed. That is 38 percent overall. But when you split by role, 14 of 20 support team leads say very disappointed, which is 70 percent. The fit is with team leads, not with solo store owners. Your next move is to focus on team leads.
What to do if you don't have product-market fit yet
- Go back to the problem. Talk to ten people who have it. Ask how they handle it today and what it costs them. If the pain is mild, the market may be too small or too casual.
- Narrow your audience. A tight group with a sharp need beats a wide group with a vague one.
- Study the people who love it. Find your few "very disappointed" users and learn what they have in common.
- Fix the first-use experience. If many drop on day one, the issue may be onboarding, not the idea.
- Test demand before building more. A landing page and a waitlist can show whether people want the thing at all.
- Check your moat. If your product is a thin layer on a model anyone can call, fit can vanish when a bigger tool adds your feature. The course Distribution and Moats, including the lesson Building on Someone Else's Model, covers this.
Be patient but set a limit. Pick a date, run a defined set of changes, then measure again. Nothing here promises a result, but a clear loop of change and measure beats guessing.
Frequently asked questions
What is product-market fit in simple terms?
It means a real group of people has a problem, your product solves it well, and they keep using it. You see it in repeat use, referrals and users who would miss the product if it were gone.
What is a good score on the Sean Ellis test?
The common benchmark is 40 percent or more of respondents saying they would be "very disappointed" without the product. It is a rule of thumb, so pair it with retention data.
How many users do I need to measure product-market fit?
For the survey, aim for at least 30 responses from people who have really used the product. For retention, you need enough users per cohort that a few people leaving does not swing the curve.
Can I have product-market fit and then lose it?
Yes. Markets change, competitors arrive and customer expectations rise. Keep tracking retention and repeat the survey every few months.
Get started
Product-market fit is easier to judge when you understand the business basics behind it: who your customer is, what they pay and what it costs you to serve them. Age of AI Entrepreneur teaches this in short hands-on lessons, with sources and every side of the debates. You sign in with your email and an emailed code, and the lessons are free to anyone with an account, as the terms page explains.
Start Age of AI Entrepreneur: short hands-on lessons on how to build a business in the age of AI, with every side of the debate and the sources to read next.
Comments
No comments yet.
Sign in or make an account to comment.