Budget problems log: each money fix and its result
Money trouble can repeat. The same overdraft, the same forgotten subscription, the same grocery overspend in the last week of the month. A budget problems log is a simple record of what went wrong with your money, what you tried, and whether it helped. You stop guessing and start keeping score. This post shows you what to write down, which fixes to test first, how to judge a fix honestly, and how to share the log with the people you split costs with.
Why keep a budget problems log beside your budget
A budget tells you where money should go. A spending tracker tells you where it went. Neither tells you why the plan broke, or what you did about it last time.
That gap is easy to fall into. You notice you are short again in March. You vaguely remember trying something in January. Did it work? You do not know, because nobody wrote it down.
A problems log fills that gap. It does not replace your budget. It sits beside it and records the breakdowns. Each entry is a problem, the fixes you tried, and the outcome of each fix. Over a few months it becomes a short list of things that work for you, plus a list of things you can stop trying.
Problem Graph is built for this kind of record. You write a problem in one line, attach the solutions you try, and mark each outcome as worked, partly, or failed. The app draws it as a map, so related problems sit next to each other instead of scattering across a notes file.
What to record for each money problem
Keep each entry small. Four parts are enough.
- Symptom. What you noticed, in one line. "Checking account below zero on the 27th."
- Cause. Your best guess at why. "Rent and car insurance both leave in the same week." You can be wrong here. You will find out.
- Fix. One specific change. "Move car insurance payment date to the 10th." Vague fixes like "spend less" cannot be tested.
- Result. What happened after you tried it. Worked, partly, or failed, plus a short note.
Here is how that looks in Problem Graph. You open the app, type Account goes negative late in the month and press Enter. It lands on the graph right away. Put it in the personal lane. Then you add solutions as ideas:
- Move insurance due date to the 10th
- Keep a 200 buffer that I do not count as spendable
- Switch to paying bills from a separate account
Mark the first one as the one you are trying. Next month, record the outcome. Say the account still dipped, but only by a little: mark it partly and write why. That single word is worth more than a page of memory.
If a cause is really a requirement for a fix, you can add it as its own node. "Need to call the insurer" is a requirement for moving the due date. Problem Graph has three kinds of node: problem, solution and requirement.
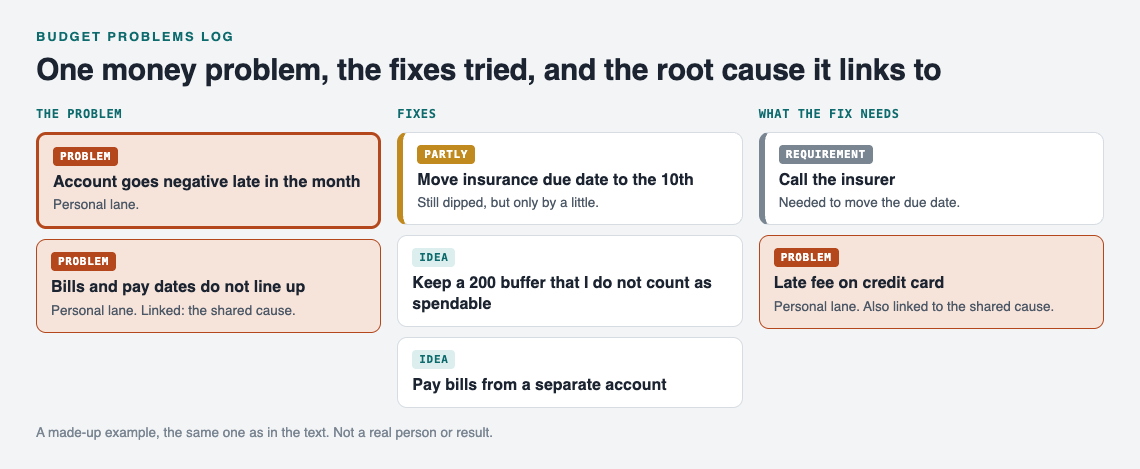
A made-up example: one money problem, its fixes, and the cause it shares with another.
Common budget problems and the fixes worth testing first
Start with the problems you can name in one line and fix with one change. Some to look for:
- Timing gaps. Bills cluster before payday. Test moving due dates, or splitting one large payment into two.
- Subscription creep. Small charges you forgot. Test a monthly ten minute scan of your statement, and cancel one thing per scan.
- Irregular costs that feel like emergencies. Car repairs, annual fees, gifts. Test a small monthly set-aside for each. If the car is a frequent culprit, keep its faults in a car problems log and link the two.
- Groceries over plan. Test a written list, one shop per week, or a cash limit for the week.
- Event spending. Trips, moves and weddings can run past the estimate. If you are in one now, the posts on moving house problems and wedding planning problems show how to keep those lists separate and still connected.
Test one fix per problem at a time. If you change three things in the same month and it improves, you will not know which change did it.
Stuck for ideas? Problem Graph has an Ask for suggestions feature. The AI proposes new solutions grounded in what worked for others on problems like yours. Treat each one as a proposal to test, not an answer. Add it as an idea, try it, and record the result like any other fix.
How to check whether a money fix actually worked
Decide what "worked" means before you try the fix. Write the test into the solution line or a note. For example:
- Fix:
Keep a 200 buffer. Worked if: the account stays above zero for two months in a row. - Fix:
Weekly cash limit for groceries. Worked if: grocery spending is at or under plan for four weeks.
Then use the three outcomes plainly:
- Worked: it met the test you set.
- Partly: it helped, but did not meet the test. Note what is still missing.
- Failed: no change, or worse.
Do not delete failures. The Problem Graph home page puts it well: "A solution that failed three times stays on the map as a failed solution, and that is exactly what the next person needs to know." The next person may be you, six months later, about to try the same thing again.
Give each fix a fair window, such as one full pay cycle, before you judge it.
Spotting repeat problems and root causes across months
A list of problems hides patterns. A map shows them. That is the main reason to keep this log as a graph.
Say you have three entries over a few months: "Account negative on the 27th", "Late fee on credit card", and "Skipped savings transfer in June". On their own they look unrelated. Link each to a shared problem node, Bills and pay dates do not line up, and the root cause is suddenly obvious. Fix that one, and three symptoms may go quiet.
Links can cross lanes too. A work problem like "Expenses reimbursed six weeks late" can link to your personal "Account negative" problem. The home page says it directly: patterns show up on the map that never show up in a list.
When you review, switch between the map and the List view in the app. The map shows clusters. The list is quicker for scanning outcomes. If you want the whole household to see problems at a glance, the ideas in visual management at home apply well to money.
One habit: when a money problem appears, log it that same day, while you still remember the cause. That is the spirit of jidoka for everyday life. Stop, write it down, try one fix.
Sharing the log with a partner or household
Money problems can be shared problems. Problem Graph gives you three levels.
- Private is the default. Only you see your problems. They are saved to your account and follow you to any phone or computer you log in on.
- Private network. Create a network, give your partner or housemates the invite code, and share a main node into it. Members see it. Nobody else does. Keep in mind the app says anyone with the invite code can join, so only give the code to people you mean to include.
- Public. Put a main node out for everyone in the app. Others can link their own problems to it and borrow solutions that worked.
Sharing works through a main node. You mark one problem as a main node, and only a main node can be shared. When you share it, its solutions, their outcomes and the requirements they need go with it. Problems you only link to it stay private.
That is useful for couples. Share Household bills and pay dates do not line up into a network with your partner. Keep My personal card balance linked to it but private. The shared part is visible to both of you, the personal part stays yours. One of you keeps the shared problem up to date; the other sees it and says what changed. The same approach works for any group splitting costs, as the carpool problems post shows.
Frequently asked questions
How is a budget problems log different from a spending tracker?
A spending tracker records transactions. A budget problems log records what went wrong, what you tried to fix it, and whether the fix worked. You use them together.
How often should I review my budget problems log?
Once per pay cycle is a simple rhythm. Log new problems the day they happen and save the outcome review for the end of the cycle.
What if a money fix makes things worse?
Undo it, mark it as failed, and write one line on why. A recorded failure stops you from trying the same fix again later.
Can couples keep one shared budget problems log?
Yes. In Problem Graph, create a private network, share the invite code with your partner, and share a main node into it. Its solutions and outcomes go along, while problems you only link to it stay private.
Get started
Open the app and write the money problem that bothers you most this month in one line. Add two or three fixes as ideas, mark one as the one you are trying, and decide what "worked" will mean. If the empty graph feels strange, use Load example set to see how a filled map looks first. It runs in your web browser and works on your phone.
Try Problem Graph: it is free, and you can look around the public network without an account. Write one problem down in a line and attach the first thing you will try.
Comments
No comments yet.
Sign in or make an account to comment.