Garden problems journal: track pests and what worked
A garden problems journal is a simple record of every pest, disease and failed crop, the fixes you tried, and how each one turned out. If you have ever stood over a chewed row of seedlings trying to remember what you did last spring, you already know why it matters. This guide shows you how to keep a garden problems journal for pests and what worked, so next season you start from evidence instead of guesswork.
Why a garden problems journal beats memory
Gardening runs on a one year loop. You meet aphids in June, deal with them somehow, and a year is a long time to hold the details. You may remember the slugs were bad, but not which fix did nothing and which one cut the damage.
A journal fixes three problems at once:
- It keeps failures. The fixes that did not work are the most useful thing to write down, because they stop you buying the same product twice.
- It shows timing. If a pest turns up around the same month each year, the dates in your notes let you act early next time.
- It connects problems. A pest problem may be tied to watering, spacing or soil. Seen together, those links are easier to spot.
If you already keep a home maintenance log, this is the same habit pointed at the garden.
What to record for every pest problem
Keep each entry short. One line for the problem is enough to start. The trick is to make that line specific. "Slugs" is too vague. "Slugs eating lettuce seedlings, raised bed 2, May 2026" tells future you where, what and when.
For each problem, record:
- The problem in one line. Pest, plant, location, month and year.
- What you will try. List every idea, even the ones you have not tested.
- What you actually tried. Mark which ideas you put into action.
- The outcome. Worked, partly, or failed. Three choices keep you honest.
- Related problems. Anything that might share a cause, like overwatering or a shady corner.
That structure maps directly onto Problem Graph, a personal problem and solution journal drawn as a knowledge graph. You write the problem in one line, put it in a lane (personal suits most gardens), and it lands on the graph the moment you press Enter. Then you attach solutions to it.
A worked example: slugs on the lettuce bed
Here is a made-up entry from start to finish. It shows how to log fixes, not which slug control works in your garden.
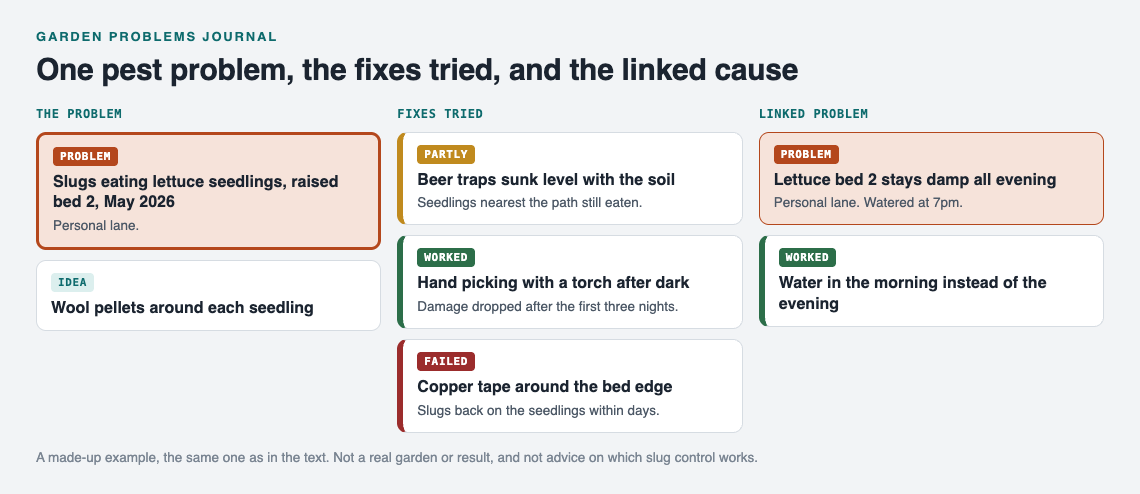
The worked example as a map: the slug problem, each fix and its outcome, and the linked damp bed problem.
The problem line: "Slugs eating lettuce seedlings, raised bed 2, May 2026."
Solutions added as ideas:
- Beer traps sunk level with the soil
- Copper tape around the bed edge
- Hand picking with a torch after dark
- Wool pellets around each seedling
- Water in the morning instead of the evening
You do not try them all at once. In the first week you mark two as trying: beer traps and evening hand picking. You leave the rest as ideas.
Two weeks later you record outcomes. Beer traps: partly. They caught slugs, but the seedlings nearest the path still got eaten. Hand picking: worked. You collected a lot on the first three nights and damage dropped sharply after that. Then you try copper tape around the bed edge. Outcome: failed. Slugs were back on the seedlings within days.
Now you link a second problem to this one: "Lettuce bed 2 stays damp all evening." You realise you water at 7pm. You move the morning watering idea to the damp bed problem, mark it as trying, and later record it as worked.
On the map, the slug problem and the damp bed problem now sit side by side with a line between them. That is the kind of connection a list hides.
Garden problems journal outcomes: worked, partly, failed
The outcome field is where a garden journal earns its keep. Problem Graph gives you three outcomes: worked, partly, or failed. The home page puts it plainly: "The graph is honest. A solution that failed three times stays on the map as a failed solution, and that is exactly what the next person needs to know."
That next person is usually you, a year later. A few rules make the outcomes useful:
- Change one thing at a time where you can. If you try four fixes in one week, you will not know which one helped.
- Use "partly" freely. A fix that reduces a problem without ending it is partly, and that is a real result.
- Never delete a failure. A failed fix is information. Leave it on the map.
- Write the outcome after a set time. Two weeks is a fair window for most pests.
If you get stuck for ideas, Problem Graph is built to show you similar problems other people have shared publicly, in any lane, and which of their solutions worked. You can borrow one into your own graph with one tap, and it keeps a link back to where it came from. You can also ask for suggestions: the AI proposes new solutions grounded in what worked for others on problems like yours. Treat those as proposals to test, then log the result like any other fix.
Spotting seasonal patterns across years
Patterns are why you keep the journal for more than one season. Because you write the month and year into each problem line, a second season makes repeats easy to spot.
Say next May you write "Slugs eating lettuce seedlings, raised bed 2, May 2027." Link it to the 2026 entry. Now you can see last year's outcomes right there: hand picking worked, copper failed, morning watering worked. You skip straight to what worked and save two weeks of trial and error.
Over a few years, look for:
- Repeat pests in the same spot. That points to a site problem, like shade, damp or a nearby hiding place.
- Clusters of problems. If slugs, mildew and rot all link to the same bed, the bed itself may be the real problem.
- Fixes that keep winning. A solution marked worked three years running deserves to become routine.
Problem Graph's own line for this is "Patterns show up on the map that never show up in a list." If you prefer scanning, there is a List view beside the map as well. A short weekly review during the growing season is a good moment to record the outcome of each fix you tried and mark the next idea you will try.
Sorting garden problems so you fix the few that matter
By midsummer your journal may list a dozen problems. You cannot fight all of them. The Pareto 80/20 rule suggests a few of them may cause most of the lost harvest; the post on the Pareto principle for everyday problems shows how to find them.
Ask two questions of each entry:
- How much does this cost me? A pest that wipes out a crop matters more than one that nibbles leaves.
- Is it urgent? Some pests spread fast and need action this week. Others can wait for the weekend.
The Eisenhower matrix is a handy way to sort them. Put your energy into the important ones, and accept a few holes in the kale.
Frequently asked questions
How often should I update a garden problems journal?
Add a problem as soon as you notice it, and record outcomes about two weeks after you try a fix. A quick weekly check during the growing season keeps it current without taking much time.
Should I use a notebook or an app for a garden journal?
A notebook works if you only need a list. An app like Problem Graph helps when you want to link related problems, see outcomes at a glance, and check your notes on your phone while you are in the garden, since it runs in the web browser.
How do I tell if a pest treatment really worked?
Try one fix at a time where you can, wait a set period, and compare damage before and after. If damage dropped but did not stop, record it as partly rather than worked.
Can I share a garden problems journal with an allotment or community garden?
Yes. In Problem Graph you mark a problem as a main node and share it into a private network, and anyone with the invite code can join and see it. Its solutions, their outcomes and the requirements they need go along, while the rest of your graph stays private.
Get started
Pick the pest that annoyed you most this year. Open the app, write it in one line with the plant, place, month and year, and add every fix you can think of as an idea. Mark the one you will try first. Your problems are private by default, so only you see them unless you choose to share a main node.
If you want to see how a graph looks before you start, the app offers an empty graph a "Load example set" button. To add your own problems you create an account with a username and a password.
Try Problem Graph: it is free, and you can look around the public network without an account. Write one problem down in a line and attach the first thing you will try.
Comments
No comments yet.
Sign in or make an account to comment.