Research log: how to record experiments that failed
Most research logs are full of things that worked. The runs that went nowhere get a line like "didn't work, moving on," or no line at all. That is a problem, because a failed experiment holds information you paid for in time and compute, and it is the first thing you forget. This guide shows how to keep a research log that records experiments that failed: what to write, when to write it, and how to connect each failure to the question you were trying to answer, so the next attempt starts from what you know.
Why failed experiments belong in your research log
A failed experiment answers a question. The answer just isn't the one you hoped for. If you don't write it down, three things happen.
- You run the same thing again in four months because you forgot you tried it.
- A collaborator runs it because there was no record to find.
- You lose the pattern. One failure tells you little. Five failures with the same suspected cause tell you a lot.
Problem Graph puts this well on its home page: "The graph is honest. A solution that failed three times stays on the map as a failed solution, and that is exactly what the next person needs to know." That next person is often you.
What counts as a failure: null results, broken setups, and wrong hypotheses
"Failed" covers different things. Each kind teaches you something different, so label which one you hit.
- Null result. The experiment ran cleanly and showed no effect. This is real evidence against your idea, at least at the scale and settings you tested.
- Broken setup. Something in the pipeline went wrong: a bug, a mislabeled sample, a config that never loaded. You learned nothing about the hypothesis, but you learned something about your tooling.
- Wrong hypothesis. The result was clear and it pointed the other way. This is often the most useful entry in the log.
- Partial result. Some of what you expected showed up, some didn't. Don't round this up to "worked" or down to "failed."
The label matters later. When you review, a pile of broken setups means fix your tools. A pile of null results means rethink the idea.
This is the same loop the Lean Enterprise Institute describes for plan, do, check, act: a cycle based on the scientific method, where you propose a change, try it, measure the results, and then either keep the change or begin the cycle again. A failed run is a finished "check". Your log entry is what makes the next "plan" better.
What to record for every failed experiment: hypothesis, setup, result, and suspected cause
Keep it to four parts. More fields mean you skip the entry when you're tired.
- Hypothesis. One sentence. What did you expect, and why?
- Setup. What you changed, what you held fixed, and where the code, data, or protocol lives. Enough that you could rerun it.
- Result. What you observed, in plain numbers or plain words. No interpretation yet.
- Suspected cause. Your best guess about why it failed, marked as a guess.
If you already keep a general problem log, this lines up with the fields in our problem log template. The difference here is the hard split between result and suspected cause.
A research log template, with a worked example
Here is the template. Copy it into whatever you write in.
- Open problem: the question this experiment serves
- Date:
- Failure type: null, broken setup, wrong hypothesis, or partial
- Hypothesis:
- Setup:
- Result:
- Suspected cause:
- Next step:
Now a made-up example from a machine learning project, filled in:
- Open problem: Validation loss spikes partway through training on the small model runs.
- Date: the day the run finished.
- Failure type: null result.
- Hypothesis: The learning rate is too high. Cutting it by a factor of three should remove the spike.
- Setup: Same data, same seed, same model size. Only the peak learning rate changed. Config saved next to the run.
- Result: The spike still appeared at about the same step. Training was slower overall.
- Suspected cause: The spike may come from the data, not the optimizer. Possibly one shard with very long or malformed examples arriving at that point.
- Next step: Log per-batch sequence lengths around that step and inspect the shard.
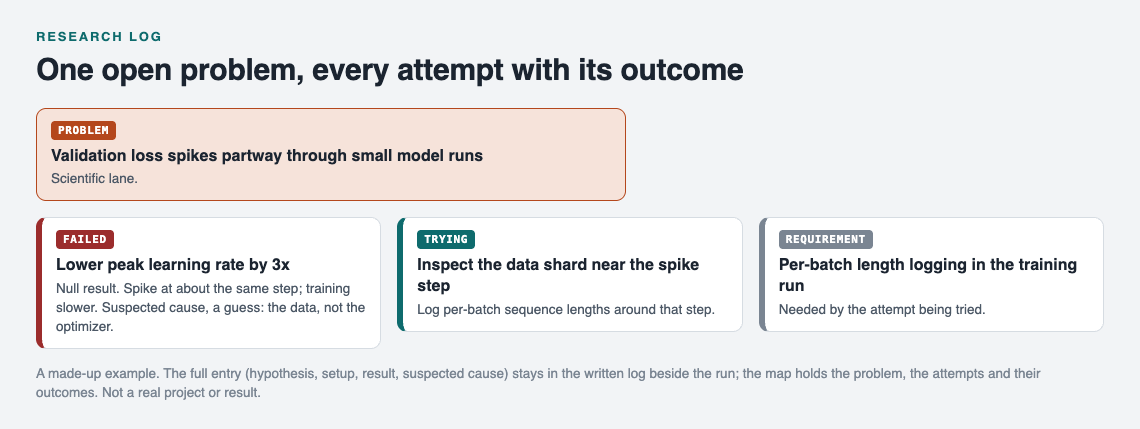
The made-up example above, kept as a map: the problem, each attempt with its outcome, and what the next one needs.
Notice what this entry does. It rules something out. It points at a new suspect. And it is short enough that you will actually write the next one.
Write it the same day: separating what happened from why you think it happened
Write the entry before you go home. By the next morning your memory has already started editing. You'll remember the run as cleaner or messier than it was, and your explanation will have quietly turned into a fact.
The most important habit is keeping result and suspected cause in separate fields. The result is what you saw. The cause is a story you're telling about it. If you blend them ("training was unstable because of the learning rate"), a later reader can't tell which part was observed and which was assumed. In the example above, a blended entry would have recorded the wrong cause as settled.
When a failure stings, a short structured reflection helps you stay honest about it. The approach in hansei: how to reflect on a solution that failed pairs well with this step. The Lean Enterprise Institute's page on hansei gives the reason it matters beyond you: reflection is there to develop countermeasures and pass them on, so mistakes are not repeated.
From failure to next step: linking each entry to the open problem it was meant to solve
A list of experiments in date order hides the most useful structure: which question each one was trying to answer. Three failures in a row look like noise in a dated list. Hung under the same open problem, they look like a pattern.
This is where a graph works better than a list. In Problem Graph, you write the open problem as one line and put it in a lane. For research, that's usually the scientific or expert lane. It lands on the graph as soon as you press Enter. Each experiment becomes a solution attached to that problem. You can add it as an idea, mark it as one you're trying, and then record the outcome as worked, partly, or failed.
For the example above, the workflow looks like this:
- Type the problem: "Validation loss spikes partway through small model runs."
- Attach a solution: "Lower peak learning rate by 3x." Mark it as trying while the run goes.
- When it finishes, mark it failed. Keep the full entry, with setup, result, and suspected cause, in your written log next to the run, so the graph shows the outcome and the log holds the detail.
- Attach the next solution: "Inspect data shard near spike step."
The app's map key also names a requirement. Use it for what an experiment depends on, like a cleaned dataset or access to a GPU, so you can see when several attempts are blocked on the same thing. You can also link problems that belong together, even across lanes. If the loss spike turns out to be linked to a separate data quality problem you've been tracking, connect them. As the home page says, "Patterns show up on the map that never show up in a list."
Reviewing your log monthly to spot repeated dead ends
Once a month, spend an hour reading back through the log. Ask four questions:
- Which open problem has the most failed attempts? Is it still worth pursuing, or should you reframe it?
- Do several suspected causes point at the same thing? That shared cause is probably your real problem.
- How many failures were broken setups? If it's a lot, spend a week on tooling.
- Which "next steps" never happened?
In Problem Graph you can filter by lane and switch to the List view beside the map. That makes it quick to scan everything in your scientific lane and see which problems have a column of failed solutions under them.

The three steps from Problem Graph's home page.
Frequently asked questions
Should I log experiments that failed because of a bug?
Yes. Label it as a broken setup and note what the bug was. It tells you nothing about your hypothesis, but repeated bug failures show you where your pipeline needs work.
How much detail is enough for a failed experiment entry?
Enough that you could rerun the experiment and understand why you ran it. In practice that means one sentence of hypothesis, a short setup note with where the config lives, the raw result, and your suspected cause marked as a guess.
Should a research log be private or shared with my team?
Keep rough working notes private and share the open problems your team cares about. In Problem Graph, problems are private by default, and you can mark one problem as a main node and share it into a private network using an invite code, so only members see it and the solutions and outcomes attached to it.
How do I keep a research log when experiments run for weeks?
Write the hypothesis and setup on the day you start, and mark the attempt as one you are trying. Add the result and suspected cause on the day it finishes, while the details are fresh.
Get started
Pick one open problem from your current project. Write it as a single line. Then attach the last experiment you ran for it and mark the outcome honestly. In your written log, record the suspected cause as a guess. An empty graph offers a "Load example set" button if you want to look first, and your problems stay private unless you share a main node.
Try Problem Graph: it is free, and you can look around the public network without an account. Write one problem down in a line and attach the first thing you will try.
Comments
No comments yet.
Sign in or make an account to comment.