Tech problems log: fixes for your own devices
A tech problems log is a running record of what broke on your own devices, what you tried, and whether it actually held. It is easy to fix the same Wi-Fi drop or printer jam several times and search for the answer from scratch each time. This post shows you how to keep that record by device, how to mark which fixes worked, and how to share it with the people who use the same gadgets.
Why a tech problems log beats searching the same fix twice
When your router drops the connection, you search, you find five suggestions, you try two, and one seems to work. Six weeks later it happens again. You remember that something worked. You do not remember which thing.
A log fixes that. Search results give you everyone's fixes for everyone's devices. Your log gives you your fix for your device, along with the fixes that did nothing. Those failed attempts matter as much as the winner. They save you twenty minutes next time.
Problem Graph fits this idea. It is a problem and solution journal drawn as a map. You write a problem in one line, attach the solutions you try, and record the outcome as worked, partly, or failed. As the home page puts it:
The graph is honest. A solution that failed three times stays on the map as a failed solution, and that is exactly what the next person needs to know.
What to record for each device problem: symptom, device, fix, result
Keep each entry small. Four things are enough:
- Symptom. What you saw, in plain words. "Phone shows a storage full warning every week," not "phone is weird."
- Device. Which one. If you own two phones, say which phone.
- Fix. Each thing you tried, as its own item, not one long paragraph.
- Result. Worked, partly, or failed. Add a short note if the fix held for a while and then stopped.
In Problem Graph, the symptom and device go into one line, the problem. Starting the line with the device name keeps things readable on the map, for example Router: Wi-Fi drops every evening around 9pm. Press Enter and it lands on the graph. Then attach solutions: Restart router, Move router off the floor, Change Wi-Fi channel. Mark the one you are trying now. When you know how it went, record the outcome.
Some fixes need something before you can try them. The map key includes a third kind of node, a requirement, next to problem and solution. Use it for things like "needs the router admin login" or "needs a replacement charging cable." When you come back later, you see right away what you need to have ready.
Set up your log by device: laptop, phone, router, printer, smart home
You do not need a separate notebook per gadget. Write each problem with its device name first, then link problems for the same device together. Linking works even across lanes, and the map draws the connections for you.
A simple layout for a home might look like this:
- Laptop: slow startup, battery drains overnight, external monitor not detected.
- Phone: storage full warning, charges slowly, Bluetooth headphones disconnect.
- Router: evening drops, one room has weak signal.
- Printer: shows offline, streaky prints.
- Smart home: a plug that goes unresponsive, a speaker that forgets the Wi-Fi.
Problem Graph sorts problems into four lanes: personal, work, expert and scientific. Your home devices fit in personal. A work laptop can go in work, and you can still link its problems to your home router if the cause turns out to be the same. In the app at problemgraph.vlvd.net/app, you can filter by lane and switch to a List view when the map gets busy.
The same structure works for anything with recurring breakdowns. If you like this approach, the home repair log applies it to taps, doors and appliances.
Common device problems worth logging and the fixes to try first
Not every glitch deserves an entry. Log a problem if it has happened twice, or if fixing it took more than ten minutes. Here are typical ones, with common first steps to attach as ideas and test on your own device:
- Wi-Fi drops: restart the router, update its firmware, move it higher and away from walls, try a different channel.
- Slow laptop: check what launches at startup, free up disk space, install pending updates.
- Phone battery drains fast: check which apps use the most battery, lower screen brightness, try a different cable and charger.
- Printer shows offline: power cycle the printer, reconnect it to Wi-Fi, remove and re-add it on your computer.
- Smart device unresponsive: unplug it for a minute, check it is on the right Wi-Fi band, reset and pair it again.
Add each step as a separate solution, even the obvious ones. "Restart" that failed is useful information. It tells you the problem is not a simple hiccup.
If you are stuck, Problem Graph has an option to ask for suggestions. The AI proposes new solutions grounded in what worked for others on similar problems. Treat these as ideas to test, not answers. Try them and record what happened.
Track whether each fix held, and drop the ones that never work
The word that matters in a tech log is "held." A fix that works today and fails next week is a partial fix. Mark it partly, and add a new solution to try.
Here is a worked example. Say your printer keeps showing offline.
- Write:
Printer: shows offline on laptop, phone can still print. - Attach
Restart printer. It works. Mark it worked. - Two weeks later, same problem. Restart works again, but only for a day. Change the outcome to partly.
- Attach
Remove and re-add printer on laptop. Mark it trying. - A month with no trouble. Mark it worked.
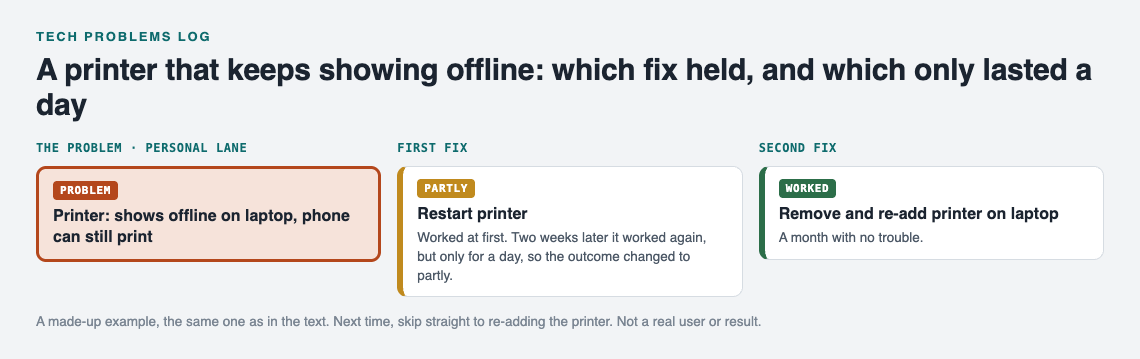
The printer example on the graph. A made-up example, not a real user or result.
Now the map shows the real story: restarting is a short-term patch, re-adding the printer is the fix. Next time, you skip straight to step four.
Fixes that fail every time deserve their own attention. Keeping them visible stops you from trying them again on autopilot. The stop-doing list post goes deeper on retiring fixes that never worked.
Spot patterns: recurring glitches, failing hardware and when to replace
A list hides patterns. A map shows them. When you link related problems, clusters appear. Problem Graph's home page says it directly: "Patterns show up on the map that never show up in a list."
Things to watch for:
- One device, many problems. If the old laptop has six linked problems and most fixes are marked partly, that is a sign it may be time to replace it.
- Many devices, one cause. If the phone, the speaker and the smart plug all drop off at night, link them to the router problem. The cause may be upstream.
- The same fix, over and over. If "restart" keeps showing up as worked on the same device every week, you are managing a symptom, not fixing a cause. That is the choice between a quick fix or a deep fix.
Share the log with your household so everyone stops guessing
Everyone in a house uses the Wi-Fi and the printer. When it breaks, whoever is home may try things at random. A shared log helps.
Your graph is private by default: only you see it, and it follows you to any phone or computer you log in on. To share, first mark a problem as a main node. Only a main node can be shared. When you share it, its solutions, their outcomes, and the requirements they need go along with it. Problems you only linked to it stay private, like the rest of your graph.
Then create a private network, give your household the invite code, and share the main node into it. Members see it, nobody else does. Keep in mind the app says anyone with the invite code can join, so give it only to people you mean to include.
A good main node to share is the router problem, with its working fix and the requirement "router admin login" under the fix that needs it. Now everyone in the network can see what worked and follow it. The same idea powers the shared carpool list.
You can also make a main node public. Others can then link their own problems to it and borrow the fixes that worked. Borrowing goes the other way too: Problem Graph shows you similar problems other people have shared, and you can borrow a solution into your own graph with one tap. It keeps a link back to where it came from.
Frequently asked questions
What should I write down when a device breaks?
Write the device, the symptom in plain words, each fix you try as a separate item, and the result: worked, partly or failed. Note anything a fix requires, like a login or a spare cable.
Is a spreadsheet good enough for tracking device fixes?
A spreadsheet works for a short list. It gets harder when one cause affects several devices, because rows do not show connections. A map with linked problems makes those links visible.
How long should I keep old tech problem entries?
Keep them as long as you own the device. Failed fixes are worth keeping too, since they stop you from repeating them, and the full history helps when deciding whether to replace something.
Get started
Pick the device that annoyed you most this month. Open Problem Graph, write the problem in one line starting with the device name, and attach the first fix you will try. If you want to see how a full graph looks first, an empty graph offers a "Load example set" button. You can browse the public network without an account. To add your own problems, create one with a username and a password.
Try Problem Graph: it is free, and you can look around the public network without an account. Write one problem down in a line and attach the first thing you will try.
Comments
No comments yet.
Sign in or make an account to comment.