Fishbone diagram example for an everyday problem
A fishbone diagram example is easier to learn from when the problem is small enough to hold in your head. The tool comes from industry, where teams use it in manufacturing, healthcare and service. This one uses an everyday problem, missing a train, and takes it all the way: the diagram, the check on each cause, the root cause, and the fix that worked.
What a fishbone diagram is
The Lean Enterprise Institute describes the fishbone diagram, also called an Ishikawa diagram or cause and effect diagram, as "a tool used to identify the root causes of a problem". It is named after the Japanese quality expert Kaoru Ishikawa, who developed it in the 1960s (Lean Enterprise Institute, Fishbone Diagram).
The shape gives it its name. You draw a horizontal line, the spine, and write the problem at the end, the head. Lines come off the spine like bones, one for each kind of cause. The same page says teams typically label the bones with five categories:
- People: what someone did or did not do.
- Equipment: tools and machines.
- Materials: the things the work needs.
- Environment: the place, the weather, the conditions.
- Methods: the way things are done.
The point of the bones is breadth. When something goes wrong, most of us jump to the first cause that comes to mind. Five labelled bones make you look in five places before you decide.
How to draw one, step by step
The Lean Enterprise Institute page sets out the order. Here it is as five steps you can follow on paper:
- Write the problem at the head. One line, with a number if you have one.
- Draw the five bones. Use the categories above, or swap one for a label that fits your problem better.
- Brainstorm causes on each bone. List every possible cause, even the ones you doubt.
- Find the root cause. Look at how the causes relate. The page suggests the 5 whys: keep asking why until you reach the cause underneath.
- Fix the root cause. Pick a solution aimed at it, not at the symptom.
Between steps 3 and 4 there is one more step most guides skip. It is the one that makes the diagram useful.
Check each cause, or it becomes a wishbone
The same page warns that people are tempted to add causes they believe or wish were happening, and "a fishbone can turn into a 'wishbone' diagram". Its advice is to include the actual physical causes.
So before you go looking for a root cause, check every cause on the diagram against what really happened. The Lean Enterprise Institute's page on problem solving puts the test as a question: "How do you know that?" Claims should rest on "verifiable facts, not assumptions and interpretations" (Lean Enterprise Institute, Problem Solving).
A simple check for an everyday problem: did this cause happen on the bad days, and not on the good days? If it happened on both, it is not what makes the difference. Mark each cause as checked yes, checked no, or unclear.
A fishbone diagram example: the missed Monday train
Here is a made-up problem, worked through from the head to the fix.
The problem. I miss the 8:15 train on Monday mornings. Over the last 5 Mondays I missed it 3 times. I already tried one fix: setting the alarm 10 minutes earlier on the last 2 Mondays. I missed the train both times, so that fix failed. The quick guess was wrong, which is a good moment to draw the bones.
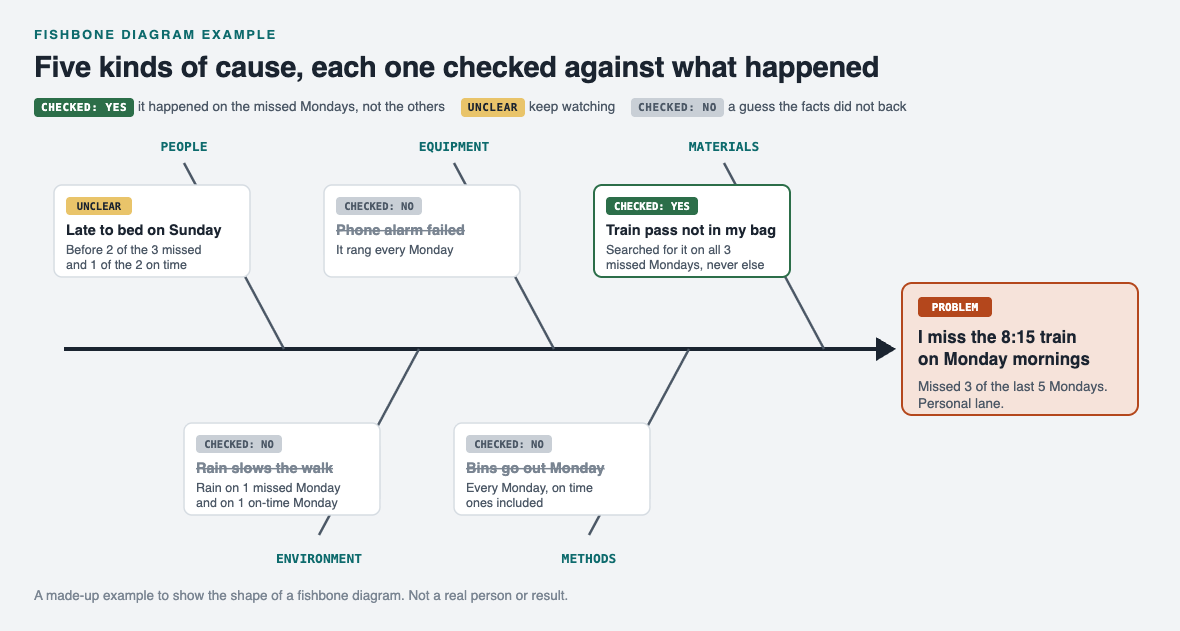
Five bones, five causes, and only one that held on every missed Monday.
The causes, and the check on each.
- People: late to bed on Sunday. After midnight before 2 of the 3 missed Mondays, and before 1 of the 2 on-time ones. Unclear.
- Equipment: the phone alarm failed. It rang every Monday. Checked no.
- Materials: the train pass is not in my bag. I searched for it on all 3 missed Mondays and on none of the others. Checked yes.
- Environment: rain slows the walk. It rained on 1 missed Monday and on 1 on-time Monday. Checked no.
- Methods: the bins go out on Monday. They go out every Monday, the on-time ones included. Checked no.
Without the check, the diagram would have five causes and a long to-do list. With it, one cause stands out and one is worth watching.
The root cause. Now ask why about the cause that held. Why did I miss the train? I spent the time searching for my pass. Why? It was not in my bag. Why? It was in the jacket I wore at the weekend. Why? It has no fixed place, so it goes wherever I happen to put it. That is four whys, not five, and that is fine. The Lean Enterprise Institute says "the specific number five is not the point" (Lean Enterprise Institute, 5 Whys). Our 5 whys example walks through a longer chain.
The fix. A hook by the front door for keys and the train pass. I caught the train on the next 4 Mondays. It needs one habit to keep working: the pass goes on the hook as soon as I get home.
Keep the result as a map in Problem Graph
A fishbone on paper helps you think, and then it goes in a drawer. Next time the problem comes back, you start again. Problem Graph is a problem and solution journal drawn as a map, and it can hold what the fishbone found.
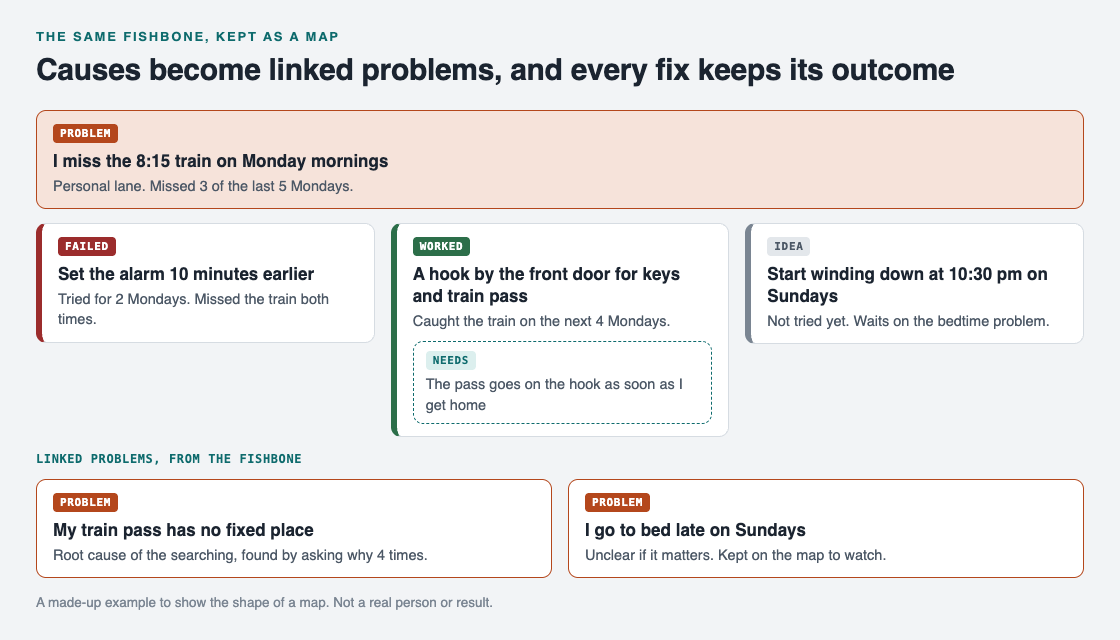
The failed fix stays, the working fix keeps what it needs, and the causes become linked problems.
Here is the train example in the app:
- Write "I miss the 8:15 train on Monday mornings" in one line and put it in the personal lane.
- Add "Set the alarm 10 minutes earlier" as a solution and record its outcome as failed. Keep it, so you never retry it by mistake.
- Add "A hook by the front door for keys and train pass" as a solution, mark it as trying, then record it as worked after the 4 Mondays.
- Add "The pass goes on the hook as soon as I get home" as a requirement of the hook.
- Write the causes that held or stayed unclear as their own problems ("My train pass has no fixed place", "I go to bed late on Sundays") and link them to the main problem. Put the idea of winding down at 10:30 pm on the bedtime problem, untried for now.
The causes marked checked no do not need a node. Their job was done once the check ruled them out.
Over time the links do some of the work a fresh fishbone would. If "My train pass has no fixed place" also turns up under a different problem, the map shows it, because patterns show up on a map that never show up in a list. Problems are private by default, so nobody else sees them unless you choose to share. For more on recording every attempt, see how to keep track of the solutions you tried.
When a fishbone is the right tool
A fishbone is worth the time when a problem keeps coming back and the first fix did not hold. It is less useful for a one-off problem with an obvious cause: if the kettle stopped because the fuse blew, you do not need five bones.
It also pairs well with a test. Once you have a fix aimed at the root cause, try it for a set time and check the result before you call it solved. Our PDCA example shows that cycle on another everyday problem.
Frequently asked questions
What are the categories in a fishbone diagram?
The Lean Enterprise Institute lists people, equipment, materials, environment and methods as the usual labels. You can swap a label for one that fits your problem better.
Is a fishbone diagram the same as an Ishikawa diagram?
Yes. Fishbone diagram, Ishikawa diagram and cause and effect diagram are names for the same tool, named after Kaoru Ishikawa.
What is a wishbone diagram?
It is a fishbone filled with causes people believe or wish were true rather than causes that actually happened. Checking each cause against the facts keeps yours a fishbone.
Can I use a fishbone diagram for a personal problem?
Yes. The five categories work for everyday problems too, as the missed train example shows. Check each cause against good days and bad days.
Get started
Pick one problem that came back this month. Draw five bones, write one cause on each, and check every cause before you choose a fix.
Try Problem Graph: it is free, and you can look around the public network without an account. Write one problem down in a line and attach the first thing you will try.
Comments
No comments yet.
Sign in or make an account to comment.