Gap Analysis Example: Where You Are and Where You Want to Be
A gap analysis compares where you are today with where you want to be, then lists what stands between the two. This gap analysis example works through one real-shaped case, a small support team that answers customers too slowly, in four steps you can reuse on any goal: measure the current state, set a measurable target, find the causes of the gap, and turn each cause into an action with an owner and a date.
Once you have found the gap, you need somewhere to keep it. Problem Graph lets you write the gap as one problem, link its causes to it on a map, and attach each fix you try with what happened: worked, partly or failed.
Gap analysis example: a slow support inbox
In management writing, gap analysis means comparing actual performance with the performance you want, then determining, documenting and improving the difference. That gives you three parts. The current state is what is true now, in numbers. The future state is what you want to be true, also in numbers, with a date. The gap is the difference, plus the reasons it exists.
Use one when you have a target and a feeling that you are far from it, but no clear list of what to change. It works for a team measure, a product goal, a skill, or a habit. If you do not understand the process yet, map it first with a SIPOC diagram.
Here is the scenario. The numbers are made up, but the shape is common. You run a support inbox for a small software product. Two people answer tickets alongside other work. Customers have started to mention slow replies. You want to know how slow, how fast you should be, and what to change first.
Step 1: Describe where you are today with real numbers
Do not start with "we are slow." Start with what you can count. Pull the last 30 days of tickets and write down:
- Median time to first reply: 19 hours.
- Share of tickets waiting more than 24 hours: 30%.
- Ticket volume: about 40 a week.
- Who answers: two people, no fixed schedule.
- Most common topics: billing, login problems, and how to export a report.
Use the median, not the average. One ticket that sat for a week over a holiday will drag the average up and hide what a normal customer sees.
Also write down how the work actually moves. Who sees a ticket first? Who passes it on? Where does it sit? If two people share one inbox, a swim lane diagram shows the exact moment a ticket belongs to nobody.
Step 2: Define where you want to be in measurable terms
A target needs a number, a measure and a date. "Faster replies" is not a target. This is:
By 31 March, the median time to first reply is under 4 hours, and no ticket waits more than 24 hours.
Check that the target is worth the effort. Ask what it changes for the customer or for you. Then describe what reaching it would look like on a normal day, the way a target condition does: a ticket arrives at 8pm, and someone has answered it by 10am the next morning.
Keep the future state small enough to reach. One clear target beats five fuzzy ones.
Step 3: Name the gap and find its root causes
The gap itself is simple: 19 hours today, 4 hours wanted, so 15 hours to close. The useful part is the why.
Ask "why does a ticket wait?" and keep asking until the answers become things you can change, as in a 5 whys example. For this team, the answers were:
- Nobody owns the inbox before 11am, so overnight tickets wait half a day.
- Billing questions wait for the one person who has access to the billing system.
- The same three answers get typed out from scratch every time.
- Tickets that need an engineer have no clear handoff, so they stall.
This is where a list starts to fail you. These causes are connected. The billing one depends on access, which is a requirement, not a fix. The engineer handoff also touches another problem you have been ignoring: bugs that customers report twice.
In Problem Graph, you would write the main gap as one line in the work lane: "First reply to support tickets takes 19 hours, target 4." Press Enter and it lands on the graph. Then add each cause as its own problem and link it to the main one. You can link across lanes too, so a cause that is really about your own week (you answer tickets in the evening because mornings are full) can sit in the personal lane and still connect. The app's map key has three kinds of node: problem, solution and requirement. "Needs access to the billing system" fits as a requirement.
Step 4: Turn the gap into actions, owners and deadlines
Each root cause gets at least one action. Each action gets one owner and one date. If an action has two owners, it has none.
- Morning gap: a rota so one person checks the inbox by 9am. Owner: Dana. Start: next Monday.
- Billing wait: give the second person read access to billing. Owner: you. By: Friday.
- Repeat answers: saved replies for the top three topics. Owner: Sam. By: end of month.
- Engineer handoff: a tag that sends a ticket to a named engineer each week. Owner: you. By: mid month.
Then measure again after two weeks. Some actions will work, some will help a bit, and some will do nothing. Write that down too.
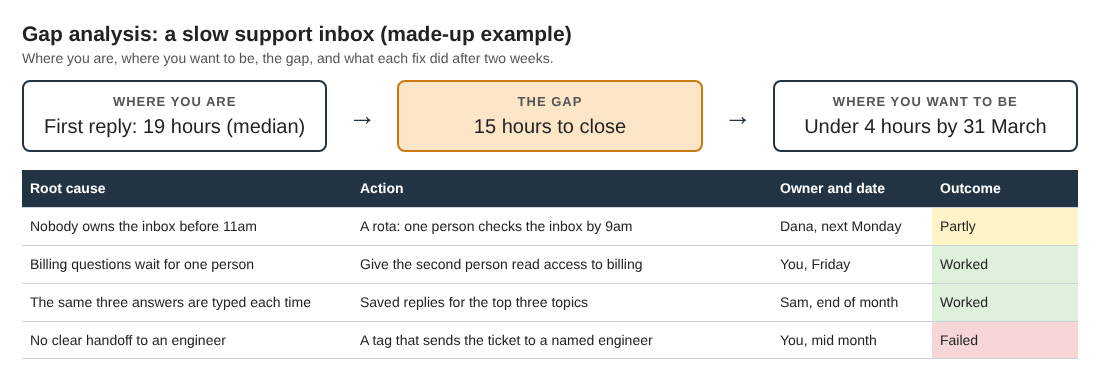
The whole example on one page: where you are, where you want to be, and what each fix did.
This is where the map earns its place. In Problem Graph, you add each action as a solution under the cause it addresses. Start it as an idea, mark it when you are trying it, and record the outcome as worked, partly or failed. The rota helped but people forgot on Fridays: partly. The saved replies cut typing time: worked. The engineer tag got ignored: failed. The product page puts it this way: "The graph is honest. A solution that failed three times stays on the map as a failed solution, and that is exactly what the next person needs to know." Next quarter, when someone suggests the same tag, you can see it already failed and why.
If you get stuck on a cause, you can ask the app for suggestions. The AI proposes new solutions based on what worked for others on similar problems. Treat them as ideas to test, not answers.
A simple gap analysis template you can copy
Copy these fields into a note, or into one problem with its linked causes:
- Goal in one line: what you want to change.
- Current state: 3 to 5 numbers, with the date range you measured.
- Future state: the target number, the measure, and the deadline.
- The gap: the difference between the two, in the same unit.
- Root causes: each one phrased as a problem you could fix.
- Requirements: what must be true before a fix can work (access, budget, a skill).
- Actions: one per cause, each with an owner and a date.
- Check date: when you will measure again.
- Outcomes: for each action, worked, partly or failed, and a sentence on why.
The last field is the one people skip. It is also the one that makes the next gap analysis faster.
Common gap analysis mistakes
- A current state made of feelings. "Things are slow" gives you nothing to measure against. Pull real numbers, even rough ones, before you set a target.
- A target with no date. Without a deadline, the gap never has to close.
- Jumping straight to solutions. If you skip step 3, you fix symptoms. Hiring a third person would not fix the morning gap if nobody owns the morning.
- Too many gaps at once. One analysis, one target. If you find a second gap, write it down as its own problem, link it, and come back to it.
- Never checking the result. An action list with no follow up is a wish list. Set the check date when you set the actions.
Frequently asked questions
What are the four steps of a gap analysis?
Describe the current state with numbers, define the future state with a measurable target and a date, name the gap and its root causes, then turn each cause into an action with an owner and a deadline.
How is a gap analysis different from a target condition?
A target condition describes what solved looks like. A gap analysis starts from that description, measures how far you are from it, and lists why the distance exists.
How do you present a gap analysis to your team?
Lead with two numbers: where you are and where you want to be. Then show the root causes and the actions, each with one owner, and ask the team to challenge the causes before they agree to the actions.
Can a gap analysis be used for personal goals?
Yes. Walking twice a week when you walk zero times now is a gap, and its causes are often small, like no set time or no shoes by the door. The same four steps apply.
Get started: map your gap as a Problem Graph
Open the app and write your gap as one line in the right lane. Add each root cause as a linked problem and each action as a solution, and mark the outcomes as you test them. Problems are private by default, so only you see them.
If your gap belongs to a team, mark it as a main node and share it into a private network by invite code. Its solutions, their outcomes and the requirements they need go with it; problems you only linked to it stay private.
Try Problem Graph: it is free, and you can look around the public network without an account. Write one problem down in a line and attach the first thing you will try.
Every problem you carry, on one map. Solved together.
Visit problemgraph.vlvd.net↗
Comments
No comments yet.