Process of Elimination: Rule Out Causes One by One
The process of elimination is a way to find what is wrong by listing every possible cause, then testing and crossing them off one at a time until only the real one is left. To make it work on a real problem you need three things: a complete list of suspects, a test for each one that can truly clear it, and a written record so a cleared cause stays cleared. Below are the four steps and a worked example you can copy.
If you want somewhere to keep that record, Problem Graph lets you write the problem down in one line, attach each thing you try, and mark whether it worked, partly worked or failed, so the map shows every cause you have already ruled out.
Process of elimination: rule out causes one by one instead of guessing
Guessing feels faster. You pick the likeliest cause, fix it, and hope. When the guess is wrong, you have changed something, the problem is still there, and you are less sure what state things are in.
Elimination is slower at the start and faster overall when:
- The problem comes back after you thought you fixed it.
- There are more than two or three plausible causes.
- The problem is intermittent, so a single good day proves nothing.
- Several people have already tried fixes and nobody wrote them down.
If the cause is obvious and the fix is cheap, just fix it. Elimination is for the problems that keep returning.
Step 1: List every possible cause before testing any
Write the full list before you touch anything. The moment you start testing, you anchor on the first idea and stop looking for others.
Go wide, and include causes that seem unlikely or embarrassing. A cause you never wrote down is a cause you can never rule out.
Useful prompts for building the list:
- What changed shortly before this started?
- What does this depend on that I do not control?
- Where does the input come from, and where does the output go?
- When does it fail, and when does it not? What is different?
Laying the problem out visually helps here. A mind map for problem solving puts every branch on one page, and if the problem lives inside a process, a SIPOC diagram makes you name the suppliers, inputs, steps, outputs and customers, each of which is a place a cause can hide.
Step 2: Rank causes by likelihood and cost to test
You will not test in list order. Give each cause two rough scores: how likely is it, and how much does it cost to test? Cost means time, money, risk, and how much you disturb the system.
Then test in this order:
- Likely and cheap. Do these first, always.
- Unlikely but cheap. A five-minute check that clears a cause is worth doing even if you doubt it.
- Likely but expensive. Plan these carefully.
- Unlikely and expensive. Leave these until the rest are cleared.
Rough scores are fine. The point is to stop spending a full day on an expensive test while a two minute check sits untried.
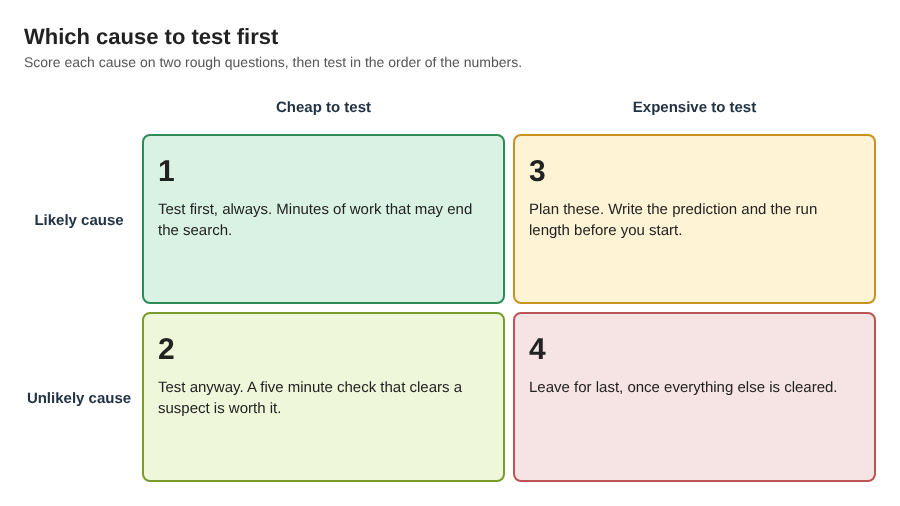
Likely and cheap first, unlikely and expensive last.
Step 3: Design one test per cause that can truly rule it out
This is where most elimination fails. A good test has a clear prediction: if this cause is responsible, I will see X; if it is not, I will see Y. If both outcomes look the same, the test tells you nothing.
Rules for a test that actually rules something out:
- Change one thing at a time. If you change two settings and the problem goes away, you cleared neither.
- Write the prediction before you run it. Otherwise you will read the result to fit what you hoped.
- Match the conditions of the failure. If it only fails at night, test at night.
- For intermittent problems, set a run length in advance. Decide how many clean runs count as "cleared" before you start, not after.
A test only counts if it could have failed. If you are unsure whether you are testing the cause or only its effect, root cause vs symptom shows how to tell the two apart before you spend a test on the wrong one.
Step 4: Record each result so ruled-out causes stay ruled out
Without a record, cleared causes come back: you return after two weeks and test the same suspect again, or remember a cause that was only partly cleared as fully cleared.
For each test, write down:
- The cause you were testing.
- What you did.
- The outcome: cleared, not cleared, or partly.
In Problem Graph, this maps onto how the app already works. You write the problem as one line in a lane (personal, work, expert or scientific). You attach each fix as a solution, mark the one you are trying, and record the outcome as worked, partly or failed. A fix that failed stays on the map. As the home page puts it: "A solution that failed three times stays on the map as a failed solution, and that is exactly what the next person needs to know." For elimination, a failed fix is useful data: it tells you that cause was probably not the one.
A worked example: tracking down why a process keeps failing
Here is an invented example to show the steps in order.
The problem, in one line: "Nightly sales report email does not arrive about twice a week." You add it in the work lane.
Step 1, the list. You write down every cause you can think of:
- The mail server rejects the message.
- The report query times out on busy nights.
- The server disk fills up and the export cannot be written.
- The scheduler skips the job when the machine restarts for updates.
- The upstream sales data arrives late, so the job runs on nothing.
- The email lands in spam for some recipients.
Step 2, the ranking. Checking spam takes one minute. Reading the job log takes five. Checking disk history takes ten. Rewriting the query is expensive. So the order is 6, then 1 and 4 from the log, then 3, then 5, then 2.
Step 3, the tests.
- Spam: ask every recipient to search spam for the missing days. Prediction: if spam is the cause, the missing emails will be there. They are not. Cleared.
- Mail server and scheduler: read the job log for each missing day. Prediction: a rejection will show an error from the mail step; a skip will show no entry at all. Every missing day has an entry and no mail error. Both cleared.
- Disk: compare disk usage on failing nights with good nights. No difference. Cleared.
- Late data: compare the time the upstream file lands with the job's start time. On every failing night, the file landed after the job started. Not cleared.
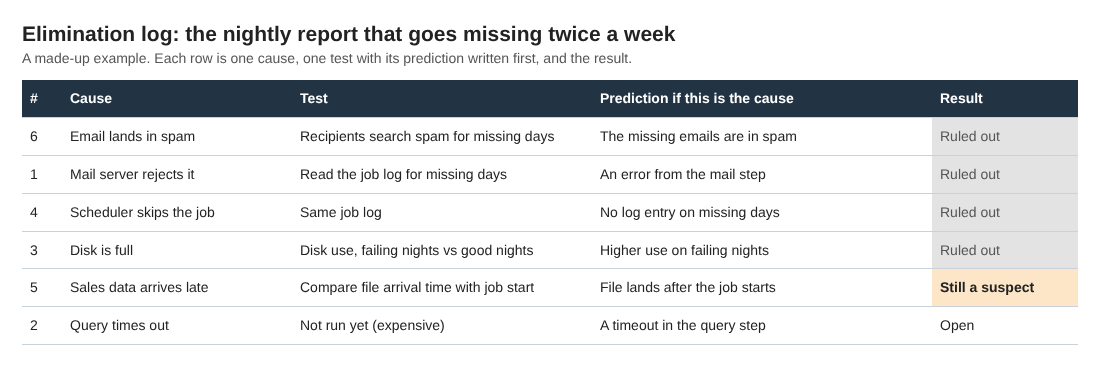
A made-up example: four causes ruled out, one still a suspect, one not tested yet.
Step 4, the record. In Problem Graph, each test sits on the map as a solution with its outcome. "Ask recipients to check spam" is marked failed. "Read job log for mail errors" is failed. "Move the job start one hour later" is the one you are now trying. After two weeks of clean runs, you mark it worked.
You notice the late upstream file also explains a separate problem you had logged months ago: the weekly dashboard sometimes shows zeros. You link the two problems. Patterns like that are easier to spot on a map than in a list.
Common mistakes that make elimination go in circles
- Changing two things at once. The problem goes away and you cannot say why.
- Clearing an intermittent cause after one good run. Twice a week means a single clean night is expected even if the cause is still there.
- Treating "partly" as "cleared." If a fix made things better but not gone, there may be two causes. Keep it on the map as partly.
- Deleting failed attempts. A clean list of only what worked hides everything you already ruled out, so someone tests it again.
When your own list runs thin, Problem Graph can show you similar problems other people have shared and which of their solutions worked, and its suggestions propose new ideas grounded in what worked for others. Treat both as more suspects for your list, not as answers.
Frequently asked questions
Is the process of elimination the same as root cause analysis?
It is one method inside root cause analysis. Root cause analysis is the goal of finding why something happens; elimination is a way to get there by clearing suspects one at a time.
What if more than one cause is responsible?
That usually shows up as a fix that only partly works. Record it as partly, keep the remaining causes open, and keep testing until the problem stops fully.
How do I know when I have tested enough causes?
You are done when one cause is confirmed by a test that could have failed and fixing it stops the problem for a run length you set in advance. If every cause on your list is cleared and the problem remains, your list was incomplete, so go back to step 1.
Get started: map your causes and rule them out in Problem Graph
Pick one problem that keeps coming back. Write it in a single line. List every cause before you test anything, rank them, and attach each test as a solution with its outcome. Ruled-out causes stay on the map, so you do not test them twice.
If you want to see how a filled graph looks first, open the app and use "Load example set" on an empty graph. You can switch between the map and the List view and filter by lane.
Try Problem Graph: it is free, and you can look around the public network without an account. Write one problem down in a line and attach the first thing you will try.
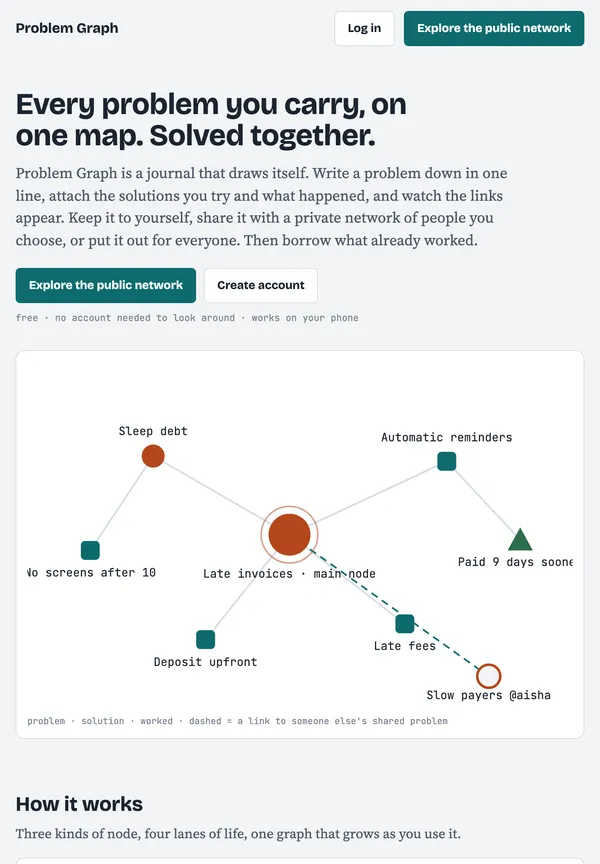
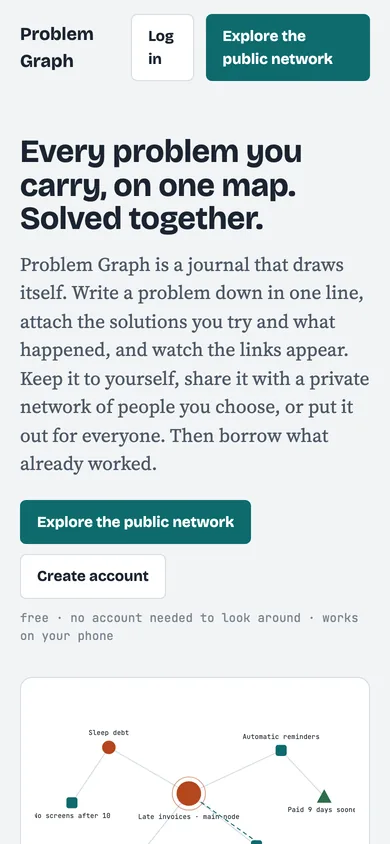
Every problem you carry, on one map. Solved together.
Visit problemgraph.vlvd.net↗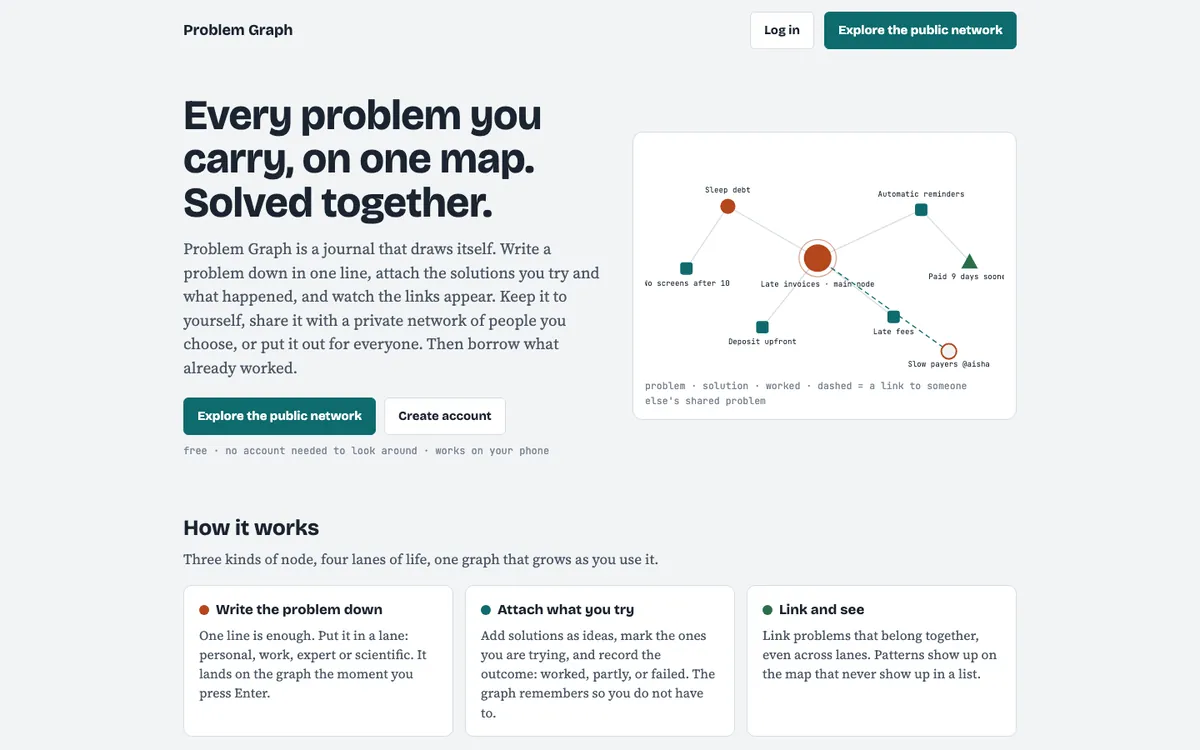
Comments
No comments yet.