Is is not analysis: narrow a problem before you fix it
Is is not analysis narrows a problem before you try to fix it. Next to each fact about where the problem shows up, you write the closest place where it could show up but does not. Any cause you suspect then has to explain both columns, and the ones that cannot are crossed off before you spend money on them.
When the analysis is done, Problem Graph keeps the problem in one line with each fix you test and its outcome (worked, partly or failed), so the next time something similar breaks you start from what you already learned.
What is is not analysis
It is a way to describe a problem precisely before you hunt for its cause. You ask a few questions about the problem, and each question gets two answers. The first is what the problem is. The second is what it is not, even though it reasonably could be.
The method comes from Kepner-Tregoe, the firm Chuck Kepner and Ben Tregoe started in 1958; their book The Rational Manager followed in 1965, according to the firm's own history. Kepner-Tregoe writes the method as IS/IS NOT, and says the concept was first introduced by the firm in 1958.
Here is why the second column helps. Say a fault hits one machine and spares an identical machine beside it. A cause that would hit both machines alike now has a lot of explaining to do. Each is not answer gives you one more test that a suspected cause has to pass.
When to use it and when to skip it
Use it when:
- The cause is unknown and people disagree about it.
- The problem used to be absent, so something must have changed.
- You have tried one or two fixes and they did not hold.
- The problem shows up in some places and not in others.
Skip it or wait when:
- The cause is already known and confirmed. Fix it.
- Something is on fire, literally or not. Contain the damage first, analyse after.
- You have a pile of loosely related complaints, not one problem. Sort them first with an affinity diagram, then run is is not on one group.
- You have no records at all. Tally the problem for a week with a check sheet so your answers come from counts, not memory.
The four questions: what, where, when and how big
This post uses four questions. Each one gets an is answer and an is not answer.
- What. Which object has the problem, and what exactly is wrong with it? Which similar object could have it but does not?
- Where. Where is the object when the problem shows up? Where on the object is the fault? Where could it be but is not?
- When. When did it first show up, and what happened around then? Is there a pattern by time of day or by step? When could it happen but does not?
- How big. How many are affected, how often, and is it growing, shrinking or steady? How big could it be but is not?
Two notes from Kepner-Tregoe's own list of common mistakes help here. The is not answer is not simply the opposite of the is answer: it is the alternative that could have happened but did not. And the when question is about linking the problem to another event or condition (during, before, after), not about writing down a date.
An is is not analysis example, step by step
Here is a made-up example. A small office has two printers of the same model, one on each floor. Since September, people on the second floor complain that print jobs jam.
Start with a one line problem statement with no fix inside it: Double-sided jobs jam on the second floor printer. Then fill in the pairs.
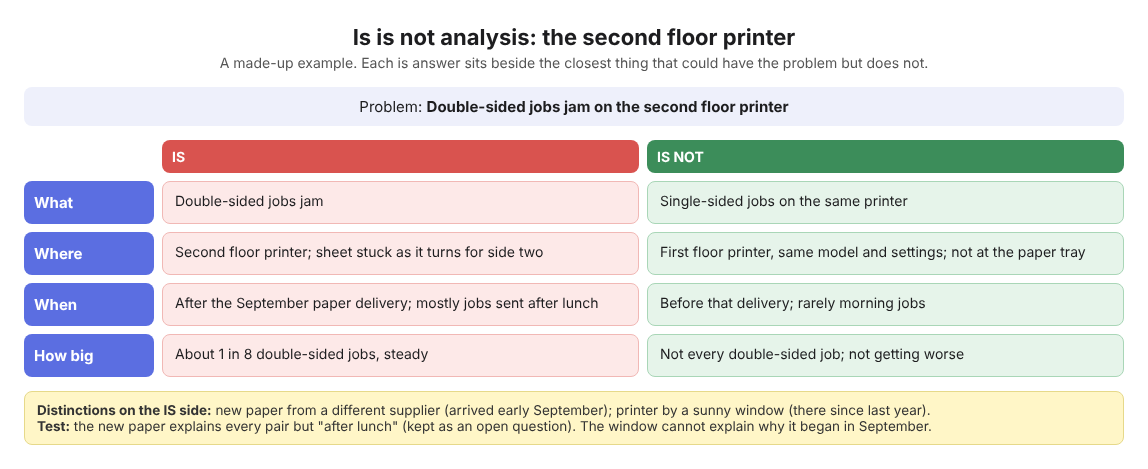
The printer example's is and is not answers (a made-up example).
- What is: double-sided jobs jam. What is not: single-sided jobs on the same printer print fine.
- Where is: the second floor printer, with the sheet stuck as it turns over for side two. Where is not: the first floor printer, same model, same settings. Not at the paper tray.
- When is: after the September paper delivery, mostly on jobs sent after lunch. When is not: before that delivery. Rarely on morning jobs.
- How big is: about 1 in 8 double-sided jobs, steady from week to week. How big is not: not every double-sided job, and not getting worse.
The page already says something. The two printers are the same model with the same settings, so "this model is bad" has to explain why the first floor is fine, and it cannot. The problem lives on the second floor, on side two, since September.
Find the distinctions and the changes
Now work through the pairs in two passes, then test each idea against every pair.
- Distinctions. For each pair, ask what is true only of the is side. In the example: the second floor printer is fed from a new box of paper from a different supplier, while the first floor still uses the old stock. It also sits next to a sunny window.
- Changes. For each distinction, ask what changed in it or around it, and when. The new paper arrived in early September. The printer has stood by the window since last year.
- Possible causes. Write each one as a statement you can test: the new paper jams when it turns over for side two; heat from the window makes the printer jam.
- Test each one against every pair. The new paper explains why single-sided jobs are fine (they never turn over), why the first floor is fine (old stock), and why it started in September. The window cannot explain why the jams began in September, since the printer has stood there for a year, so it is crossed off for now.
The paper idea leaves one gap: why after lunch? Write that down as an open question rather than hiding it. Kepner-Tregoe's account of its problem analysis says a possible cause has to explain both the is and the is not data, and the most probable cause is the one with the fewest, most reasonable assumptions. Here the paper needs one assumption; the window would need you to ignore the when pair entirely.
Then test it with a small change you can undo: load the second floor printer with the old paper for two weeks and keep counting jams.
Common mistakes that make the problem wide again
- Thin is not answers. Kepner-Tregoe lists sparse is not information as its first common mistake. Fill that column as carefully as the first.
- Is not answers that are too far away. Compare with the nearest thing that works, not with anything at all.
- A fix hiding in the problem statement. "We need better paper" assumes the cause. "Double-sided jobs jam on the second floor printer" does not.
- Answers from memory. "It started sometime this autumn" is weaker than a dated log.
- Skipping how big. A steady rate and a growing rate are different clues.
- Stopping at the first cause that fits one pair. Test it against all of them.
- Two problems at once. Paper jams and slow printing need two separate analyses.
- Throwing away failed fixes. If someone cleaned the rollers last month and the jams went on, that is evidence. Keep it.
Frequently asked questions
What is the difference between is is not analysis and the 5 whys?
The 5 whys follows one chain of cause and effect by asking why again and again. Is is not analysis compares where a problem appears with where it could appear but does not, which helps when several causes look possible and you need facts to choose between them.
Who created the is is not method?
Kepner-Tregoe, the firm Chuck Kepner and Ben Tregoe started in 1958, says it first introduced the IS/IS NOT concept that year. Their book The Rational Manager came out in 1965.
Can I use it for software bugs or service problems?
Yes. For a bug, the pairs might be which browser, which account type, which release and which hours, compared with the closest ones that work. For a service problem, compare the customers, places and staff where it happens with those where it does not.
How do I test the most likely cause?
Make one small change you can undo that should stop the problem if the cause is right, such as going back to the old paper for two weeks. If the problem stays, the cause is wrong or only part of the story, so go back to your pairs.
Get started
An is is not page tends to get lost once the problem is fixed. Here is how to keep it on a map instead.
- Open the app and write the problem in one line: Double-sided jobs jam on the second floor printer. Put it in the work lane and press Enter.
- Add each fix as a solution idea: Go back to the old paper, Clean the rollers, Move the printer away from the window. Mark the one you are trying now.
- When the test ends, record the outcome as worked, partly or failed. A failed fix stays on the map as failed, which is what you want to see next time.
- Link related problems, such as Printing is slow on Mondays, even across lanes.
Your problems are private by default. If the office should see the result, mark the problem as a main node and share it into a private network with an invite code; its solutions and their outcomes go along with it.
Try Problem Graph: it is free, and you can look around the public network without an account. Write down one problem you keep fixing and the first thing you will test.
Every problem you carry, on one map. Solved together.
Visit problemgraph.vlvd.net↗
Comments
No comments yet.