Spaghetti diagram at home: map your steps and cut walking
A spaghetti diagram at home is a sketch of your floor plan with a single pen line that follows you through one routine. Every trip to the fridge, the sink or the hallway becomes another strand, and after ten minutes the page looks like a plate of spaghetti. That tangle is the point. To map your steps, you pick one routine, draw the rooms, trace each walk as it happens, then count the trips and the distance. The busiest strands show you where you lose time, and they often point to a small change in where things are kept.
Once you have a fix to test, Problem Graph gives you a place to write the problem in one line, attach each layout change you try, and record whether it worked, partly worked or failed.
What a spaghetti diagram at home shows you
A to-do list tells you what you did. A spaghetti diagram tells you how far you walked to do it. Your morning may have the right steps in the right order and still feel slow, because the lunchboxes live on one side of the kitchen and the fridge is on the other.
The diagram makes three things visible:
- Frequency. Which spots you visit again and again.
- Distance. How long each walk is, and the total for the routine.
- Pattern. Where your path crosses itself, doubles back or makes a long trip for one small item.
The idea comes from lean manufacturing. The Lean Enterprise Institute defines a spaghetti chart as a diagram of the path a product takes through the steps of a value stream, named because that route often looks like a plate of spaghetti. Wikipedia's article notes the diagrams were first used to track routing through a factory. At home, the product is you.
It is a close cousin of the value stream map. If you have already done a value stream map for a daily routine at home, the spaghetti diagram zooms into the physical movement inside one of those steps.
Pick one routine and sketch your floor plan
Choose one routine that repeats every day and already annoys you: making breakfast and packing lunches, doing laundry, getting out the door, or cooking dinner. A diagram of the whole house on a whole day is unreadable.
Now draw the space. A rough scale helps, but you do not need a ruler. Mark the fixed points the routine touches:
- Appliances: fridge, kettle, toaster, hob, washing machine.
- Storage: cupboards, drawers, the shelf where bags or shoes go.
- Work surfaces: the counter you actually prep on.
- Exits and endpoints: the bin, the sink, the front door.
Label each one with a short letter: F for fridge, S for sink, B for bin.
Map your steps: trace every trip with a pen line
Run the routine as you normally would, without tidying first. You want the real path, not the ideal one.
There are two ways to trace it:
- Draw as you go. Keep the sheet on the counter and add a line each time you move.
- Have someone watch. A partner or older child holds the sheet and draws while you work.
Use one continuous line where you can. Draw an arrow at the end of each trip so you can see direction. If you walk the same route twice, draw it twice. Doubling up is what makes the busy routes look thick.
Here is a worked example. Say you are making breakfast and packing two lunches. Your first ten trips might look like this: counter to fridge, fridge to counter, counter to cupboard for bowls, cupboard to counter, counter to fridge for milk, fridge to the drawer for lunchboxes on the far wall, drawer back to fridge, fridge to counter, counter to bin, bin to counter. Already you can see a loop forming between the fridge and that far drawer.
Count the trips and measure the distance
When the routine ends, count the strands. Write the number of trips between each pair of points. Fridge to counter: 9. Counter to sink: 8. Counter to cupboard: 6. Counter to bin: 5. Fridge to far drawer: 4. Counter to far drawer: 4. Counter to hallway hook: 2.
For distance, pace each route once and multiply by the number of trips, or use a tape measure on the few routes that matter most.
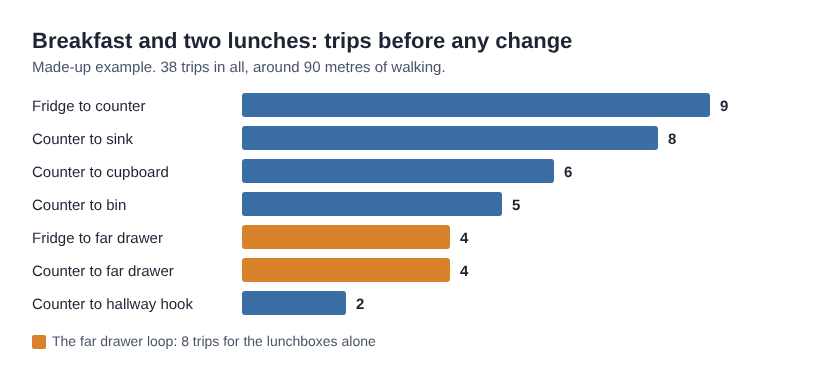
The made-up breakfast example: trips between each pair of points before any change.
In the breakfast example, you might total 38 trips and around 90 metres of walking inside one small kitchen. Your numbers will be different. What matters is that you now have a baseline to compare against after you change something.
Time the routine too. Walking is not the only cost, but if the walking drops and the clock does not, you know the slow part is somewhere else.
Spot the waste: crossings, backtracks and long hauls
Lay the sheet flat and look for three shapes.
Crossings
Lines that cross in the middle of the room mean two parts of the routine are fighting for the same space. In a shared kitchen, this can be where people bump into each other.
Backtracks
A line that goes A to B and straight back to A, then out to B again, means you forgot something or the items for one task are split between two places. Milk in the fridge, cereal by the fridge, bowls across the room is a classic backtrack.
Long hauls
One long strand for a tiny task, like walking to the hallway to get a lunch bag, is easy to fix and easy to miss without the diagram.
Circle the thickest bundle of lines. That is the first place to look. If you want a method for choosing the single constraint to attack first, the post on theory of constraints at home walks through it.
Redesign the layout and draw the new path
Now move things, on paper first. The basic rules are simple:
- Keep items used together, stored together.
- Put the most visited items closest to the work surface.
- Store things at the point of first use, not where they happen to fit.
- Gather everything before you start, so the walking happens once.
In the breakfast example, you might move the lunchboxes to the cupboard next to the fridge, put a small bin under the prep counter, and hang the lunch bags on a hook by the kitchen door. Draw the new path you expect. Then run the routine again with a fresh sheet and draw what actually happens.
Expect some changes to work and some not to. Maybe the lunchbox move ends the far drawer loop. Maybe the small bin fills too fast and you walk to the big one anyway. Change one or two things at a time, so you can tell which move made the difference.
Track the fix and link it to your bigger routine
A spaghetti diagram is a snapshot. The value comes from comparing before and after, and from keeping a record of what you already tried, so a sheet thrown away does not take the lesson with it.
Here is how the breakfast example looks in Problem Graph. You write the problem in one line, such as Too much walking back and forth when making breakfast and lunches, put it in the Personal lane, and press Enter. It lands on the graph straight away.
Then you attach the solutions as you test them:
- Move lunchboxes to the cupboard by the fridge. Outcome: worked.
- Small bin under the prep counter. Outcome: partly.
- Keep lunch bags in the hallway as before. Outcome: failed.
The failed one stays on the map. Next time you rearrange the kitchen, you can see what you tested and how it went.
Your walking problem is rarely alone. It may sit inside a bigger one, like Mornings run late, next to other problems such as getting shoes on or a slow shower. Problem Graph lets you link problems that belong together, even across lanes, so the walking fix sits beside the rest of the morning on one map. The same habit works for other home problems where you test several fixes, like the approach in logging what you tried for noise problems.
Everything is private by default. Only you see it. If you want your household to see the morning plan, you can mark the bigger problem as a main node and share it into a private network, then give your family the invite code. When a main node is shared, its solutions, their outcomes and the requirements they need go along with it. If you get stuck, you can ask for suggestions: the AI proposes new solutions grounded in what worked for others on problems like yours. Treat them as ideas to test on your next diagram.
Frequently asked questions
Do I need special software to make a spaghetti diagram?
No. A sheet of paper, a pen and a rough sketch of the room are enough. Software is more useful afterwards, for keeping track of which layout changes you tried and how each one went.
How long should I observe a routine before drawing it?
Observe one full run of the routine from start to finish while you draw. If the routine changes a lot day to day, trace it on two or three different days and compare the sheets.
Can I use a spaghetti diagram for a whole family's movement?
Yes. Give each person a different pen colour on the same floor plan. Where colours cross often, people are competing for the same space, and that is a good first thing to look at.
How is a spaghetti diagram different from a value stream map?
A value stream map shows the steps of a routine in order and where time is lost between them. A spaghetti diagram shows the physical path you walk inside those steps. You can use the value stream map to find the slow step, then a spaghetti diagram to see the walking inside it.
Get started
Print or sketch your floor plan tonight. Run tomorrow's breakfast, trace every trip, and circle the thickest bundle of lines. Then write that one problem down and attach the first layout change you will test.
Try Problem Graph: it is free, and you can look around the public network without an account. Write one problem down in a line and attach the first thing you will try.
Every problem you carry, on one map. Solved together.
Visit problemgraph.vlvd.net↗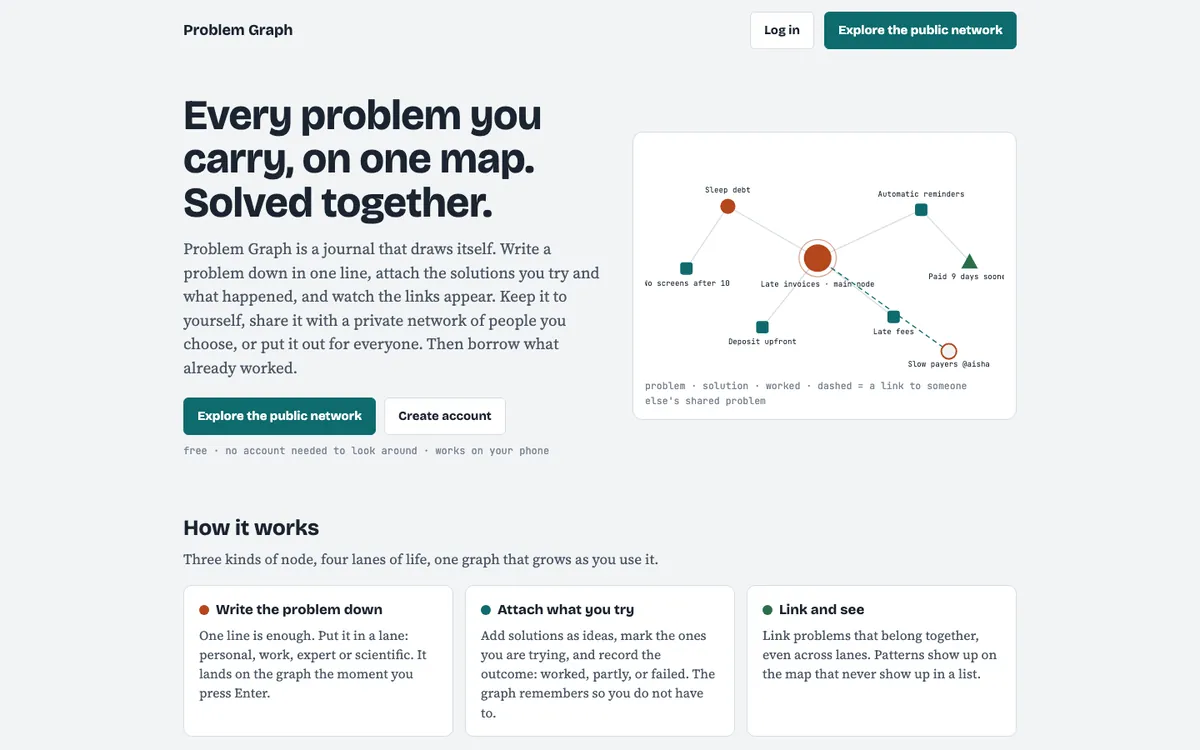
Comments
No comments yet.